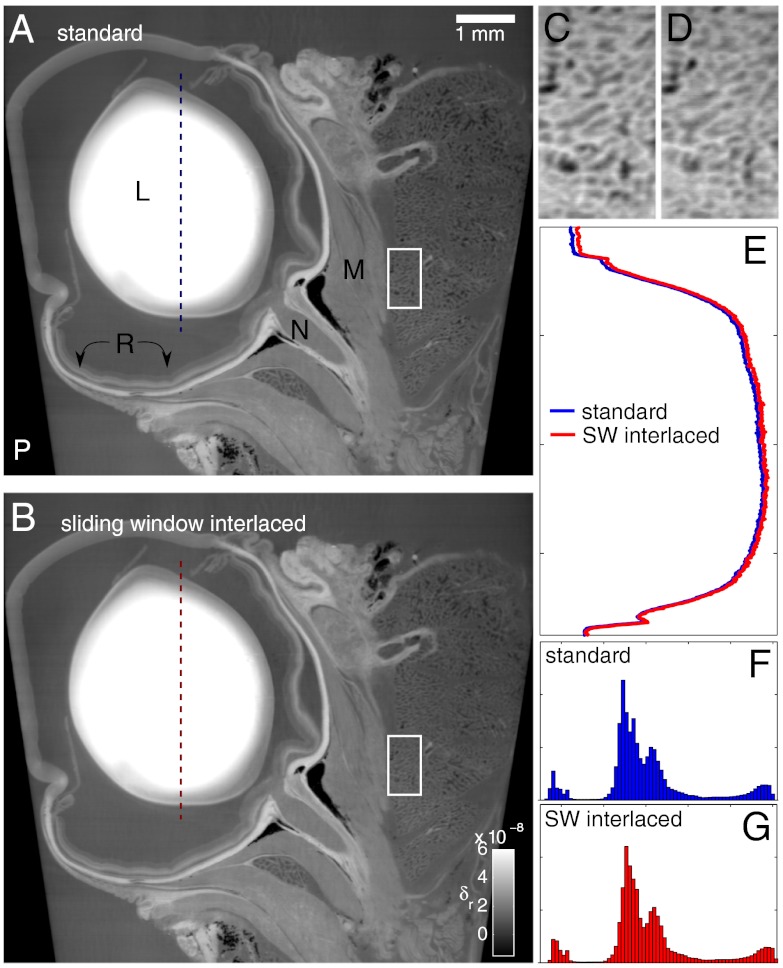
Fig. 5.
Sagittal views of phase tomograms of a rat eye obtained with the standard (A) and SWI (B) acquisition schemes; the dose delivered to the sample during the tomography performed with standard stepping was four times higher than the dose given to the sample during the SWI scan. Some of the anatomical features in the images are labeled with capital letters; see main text. The plastic container is indicated with the letter “P.” C and D show enlarged views of the regions indicated by rectangles in A and B, respectively. The profile plots in E show the refractive index in the lens—the δr values in this plot go from 0 to 1 × 10⁻⁷. The histograms of the entire sagittal slices are shown in F and G. The δr values in the x axis go from -2 × 10⁻⁸ to 8 × 10⁻⁸. The y axis of the histograms represents the frequency of appearance of the gray levels in the slices; its range is the same for the two plots.

