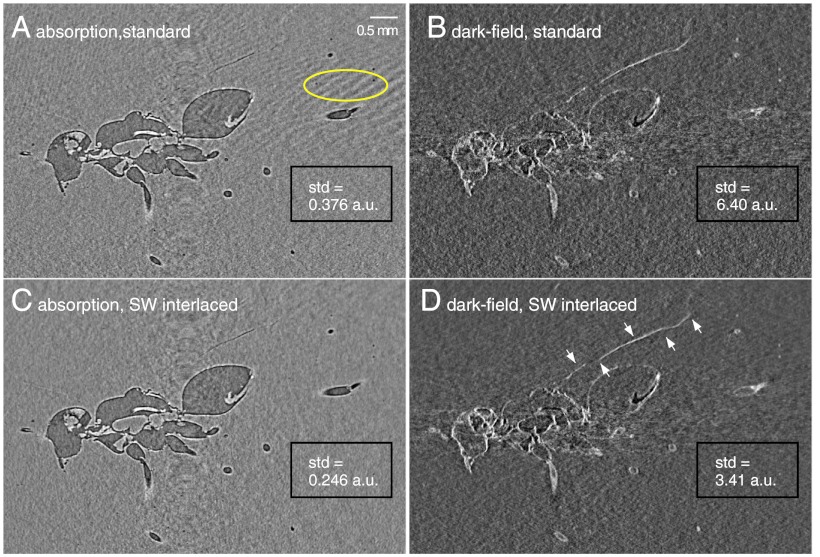
Fig. 6.
XGI tomograms in absorption and in-line phase contrast (Left) and dark-field (Right) of an insect in opaque amber. Dark-field images show details that are not fully revealed in the absorption/phase-contrast data, such as the wing of the insect, indicated by arrows in D. The tomograms in the Top were obtained with the standard phase-stepping method, those in the Bottom with the SWI method. The dose and number of raw interferograms were the same for both methods. For both absorption and dark-field signals, the image noise is significantly reduced using the SWI method as shown by the standard deviation (std) of the gray levels in the uniform region at the bottom right of the images.

