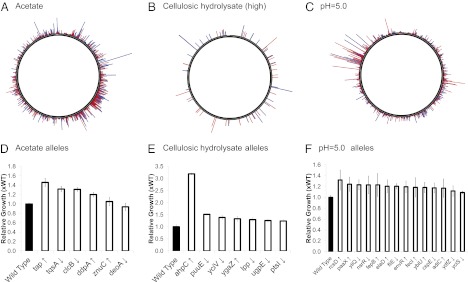
Fig. 2.
(A–C) Circle plots showing the result of TRMR analyses for acetate (16 g/L), hydrolysate (18–20%), and low pH. Clone fitness is mapped over the E. coli genome. Peak location represents location of clone in E. coli genome; peak size is relative to fitness. Colors denote the type of mutation in the clones: red spikes indicate an up mutation, blue spikes are down mutations. [B is adapted from Warner et al. (1).] (D–F) Growth studies of individual TRMR mutants. (D) Twenty-four-hour growth in 16 g/L acetate. (E) Fourteen-hour growth in 27.5% hydrolysate. (F) Twelve-hour growth in pH 5.0 M9 media. Error bars represent 1 SD.

