Fig. 2.
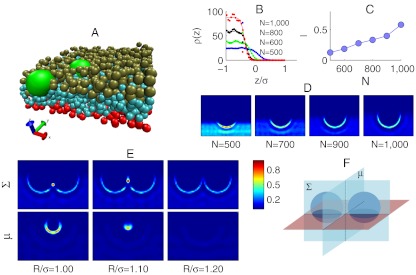
Monte Carlo simulations of colloids partially embedded in a polymer network. (A) Snapshot of the system. The two colloids are represented by big light green beads. Smaller beads represent blobs: bottom layer (red), bulk layers (light blue), and top layer of the network (green). (B) Density profile ρ(z) of the blobs in the direction z perpendicular to the surface of the network in presence of a single colloid. Here, z = 0 corresponds to the center of the colloid. Symbols indicate simulation results; solid lines are fitting curves using Eq. 9. (C) Penetration of single colloids as a function of N. (D) Color maps of the blob-density distribution around single colloids at different N. The section is taken from the vertical plane passing through the equator of the colloid. (E) Color map of the blob-density distribution around two colloids at different center-to-center distance R and N = 1,000. Sections are taken from planes Σ and μ, as schematically displayed in F. All the simulation are run using b = 0.005σ and δ = 0.1. In D and E the density is normalized to the maximum of each panel. The legend applies to both.

