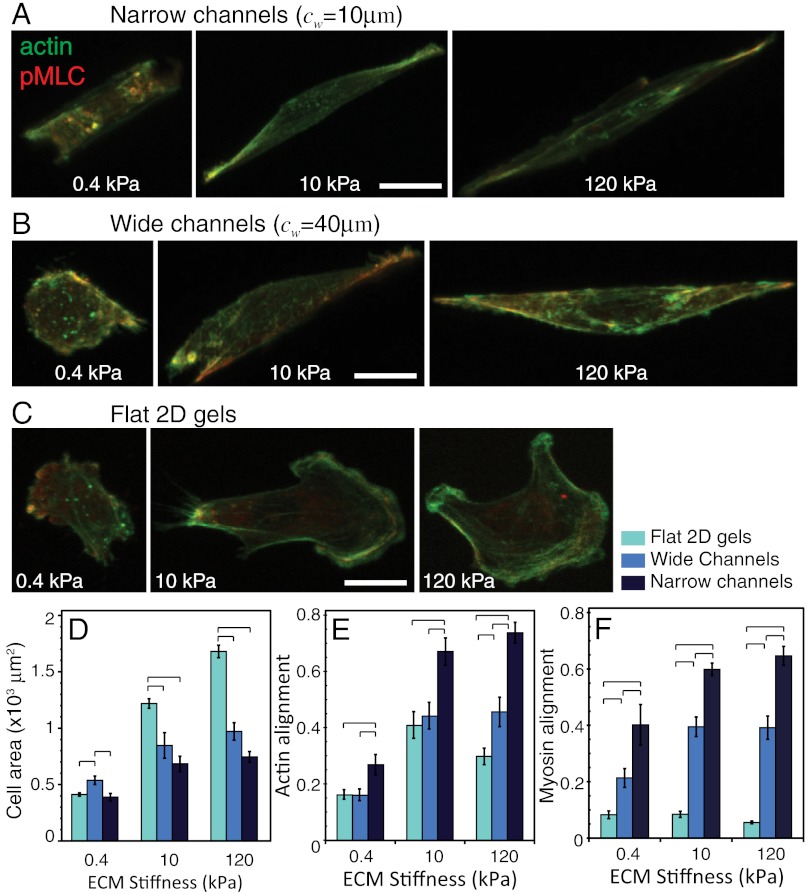
Fig. 4.
Stress fiber alignment and spreading area of cells in defined confinement. Confocal images of F-actin and pMLC distribution for U373-MG cells in (A) narrow channels (cw = 10 μm), (B) wide channels (cw = 40 μm), and (C) unconfined flat 2D gels of varying ECM stiffness. Scale bar = 20 μm. (D) projected cell area, (E) F-actin alignment, and (F) coalignment of pMLC immunofluorescence with channel axis as a function of ECM stiffness for varying degrees of confinement. Statistically different pairs (p < 0.05) are indicated by horizontal square brackets. n > 12 cells per condition.

