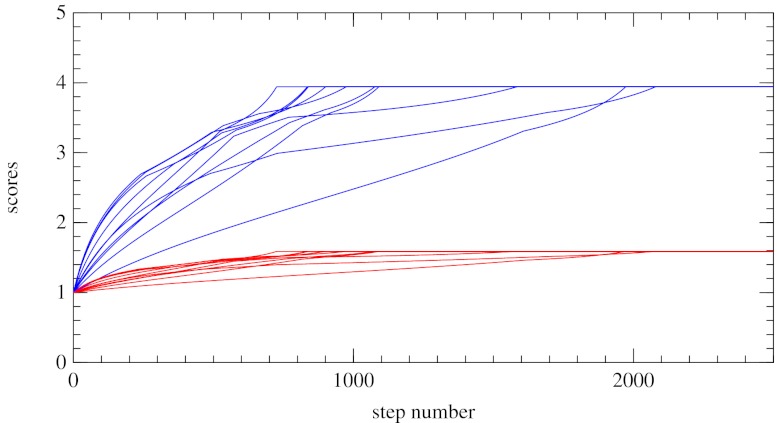
Fig. 3.
Evolution of X’s score (blue) and Y’s score (red) in 10 instances. X plays a fixed extortionate strategy with extortion factor  . Y evolves by making small steps in a gradient direction that increases his score. The 10 instances show different choices for the weights that Y assigns to different components of the gradient, i.e., how easily he can evolve along each. In all cases, X achieves her maximum possible (extortionate) score.

