
Fig. 3.
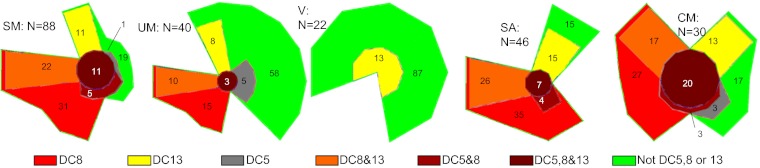
Color-coded, areal-proportional Euler diagrams showing the proportion (%) of patients transcribing high levels of genes encoding DC8, DC13, or DC5, or combinations thereof. The green areas show the percentage of patients in which parasites did not transcribe genes coding DC8, DC13, or DC5 at high levels. The five diagrams show patients with severe malaria (SM), uncomplicated malaria (UM), infections treated at village dispensaries (V), severe anemia (SA), and cerebral malaria (CM), respectively. The number of patients in each group (N) is shown. High transcription was defined as Tu > 8 units, which roughly corresponded to half the level of seryl-tRNA-synthetase transcripts.