Fig. 6.
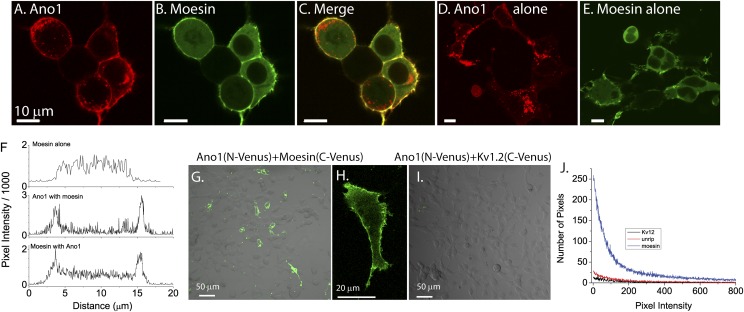
Colocalization of moesin and Ano1 in HEK cells. (A–C) HEK cells were transfected with Ano1–mCherry (red, A) and moesin–EGFP (green, B). (C) A and B superimposed. (D and E) Cells transfected with Ano1–mCherry alone (D) or moesin–EGFP alone (E). (F) Profiles of transcellular fluorescence in cells expressing only moesin–EGFP or moesin–EGFP plus Ano1–mCherry. Profiles were obtained by drawing a line across the cell avoiding the nucleus where moesin is excluded. Profiles are representative of >10 cells selected at random. (G–J) Bimolecular fluorescence complementation (BiFC). (G) Cells were cotransfected with Ano1 tagged with Venus(1–155) and Moesin tagged with Venus(156–239). (H) High power showing membrane localization of the BiFC fluorescence. (I) Control for BiFC. Cells were transfected with Ano1–Venus(1–155) and Kv1.2–Venus(156–239).(J) Quantification of BiFC. Histograms of pixel intensity for fields transfected with Ano1–Venus(1–155) plus moesin–Venus(156–239), the potassium channel Kv1.2–Venus(156–239), or the survival of motor neurons (SMN) complex subunit unrip–Venus(156–239).

