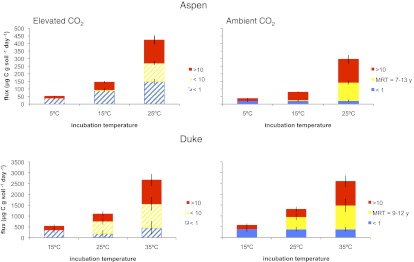
Fig. 4.

Cumulative respired CO2 (micrograms C grams soil−1 day−1) partitioned by modified isotopic mixing model. Solid bars represent soil CO2 fluxes with the 14C signature of the atmosphere, and hatched bars represent soil CO2 fluxes with the 14C signature of the FACE label. Colors represent the age of C: red, >10 y; yellow, intermediate-aged and warming-induced C; blue, <10 y for elevated CO2 soils and <1 y for ambient CO2 soils. Error bars represent SEMs propagated through the mixing model.
