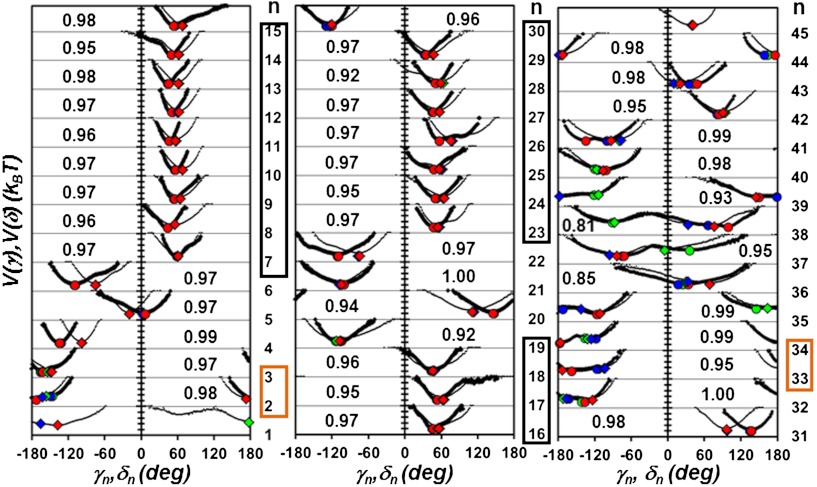
Fig. 1.
Effective FEPs V(γn) (thick lines) and V(δn) (thin lines) computed from MD along the primary sequence (γn, n = 2 to 44 and δn, n = 1 to 45). The FEPs computed from the five concatenated MD runs (400 ns) are shown. Residues n located in a helix are in a black box and residues located in a β-sheet are in an orange box. For each residue n, the number in the inset is the value of the similarity index h between the FEPs V(γn) and V(δn) defined in the Results section: Comparison of the FEPs of the CGDAs. The circles and the diamonds represent respectively the maxima of the distributions of the angles γn and δn computed in each of the three states defined on the free-energy surface of the principal components PC1/PC2 defined in the Discussion section: Main-chain motions, side-chain motions and collective modes. The state 1 is indicated by a red symbol, the state 2 is indicated by a blue symbol and the state 3 is indicated by a green symbol.

