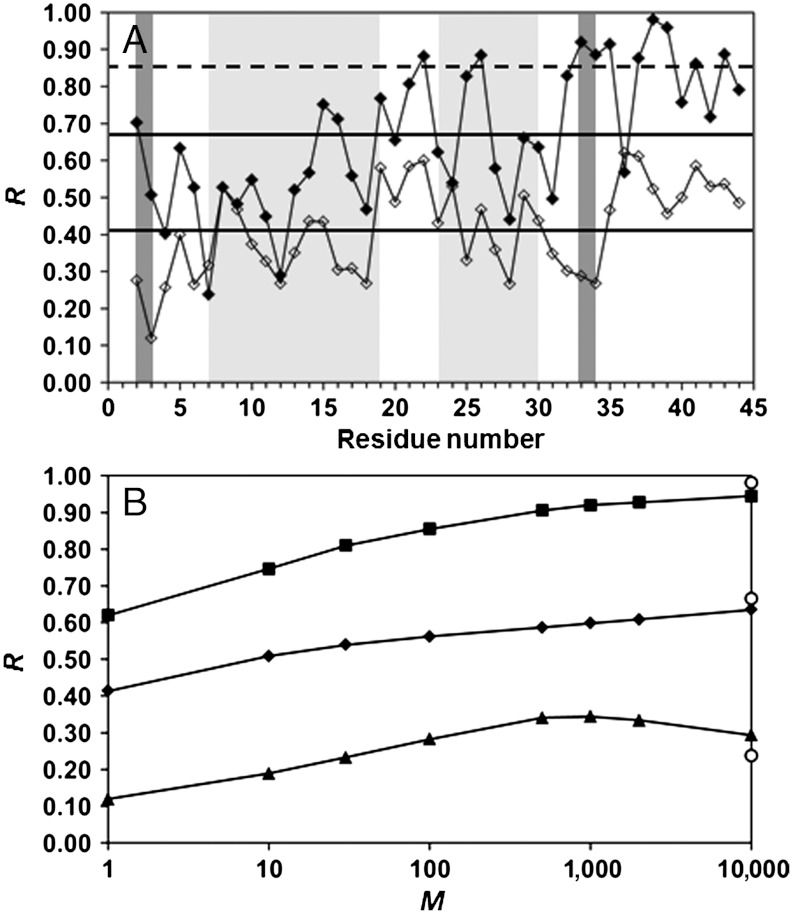
Fig. 3.
(A) Comparison of the correlation coefficient R between the trajectories γn(t) and δn(t) (filled symbols) and between the steps Δγn(t) and Δδn(t) (empty symbols) along the amino acid sequence of VA3. The α-helices and β-sheets are indicated by light gray and dark gray stripes, respectively. The full horizontal lines represent R averaged over the primary sequence (Ravg) for the steps (lowest) and for the trajectories (highest). The dashed line represents the value Ravg + σ = 0.85 for the trajectories. (B) Maximum (squares), average (diamonds), and minimum (triangles) values over the amino acid sequence of the correlation coefficient Rn(M) between the displacements Δγn(t; M) and Δδn(t; M) as function of the logarithm of the number M of steps. The value of Rn(M) was computed for M equals to 1, 10, 30, 100, 500, 1,000, 2,000, and 10,000. The values of Rmax, Ravg and Rmin computed between the γn(t) and δn(t) trajectories are shown for comparison (circles) at M = 10,000. All calculations were performed from the five MD runs (over 400 ns).

