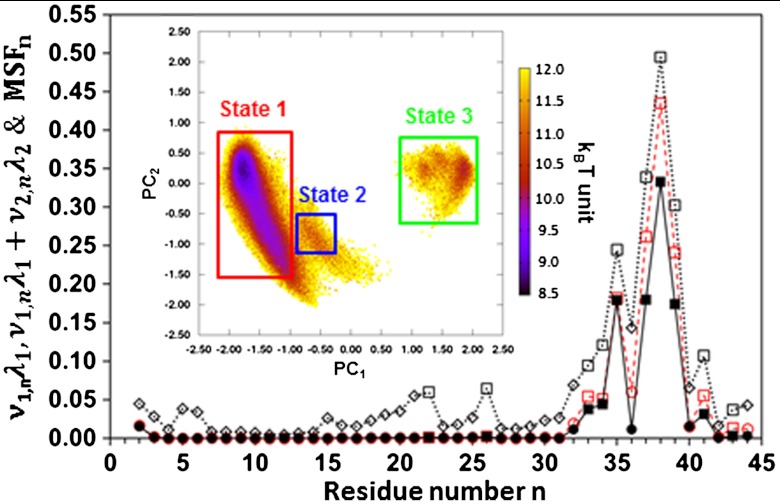
Fig. 4.
Contribution of mode 1 (λ1ν1,n, filled diamonds and squares and full lines) to the MSF, contribution of modes 1 and 2 (λ1ν1,n + λ2ν2,n, red empty circles and red squares and red dashed lines) to the MSF, and MSF (empty symbols and dotted lines) along the amino acid sequence of VA3. CGDAs with multiple-minima potentials (Fig. 1) are shown by squares. The inset represents a color map of the FEL built from the principal components of modes 1 and 2 (PC1 and PC2). Three structural states 1 (red), 2 (blue), and 3 (green) were defined by the three rectangular regions in the FEL. All calculations were performed from the five MD runs (over 400 ns) by applying dPCA to the vectors un(t) = { cos[γn(t)], sin[γn(t)]}.

