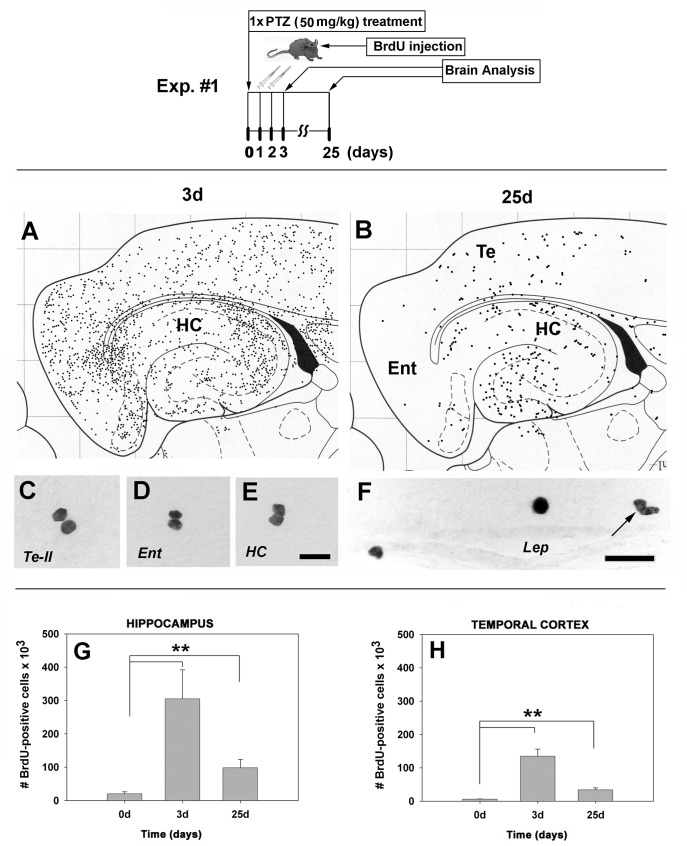
Figure 1. Diagrams.
(Upper panel): Flow diagram of Exp. #1 regarding times and type of treatment with pentylenetetrazole. (Lower panel): Schematic diagram of the distribution of proliferative (BrdU-positive) cells in the brain at day 25 after a single administration of a convulsive dose of PTZ. Note the change from a widespread distribution (A) to a more restricted distribution at 25 days post-seizure (B). In control rats, there were only a few BrdU-positive cells, often in a duplex, mitosis-like state (C, D, E). Many proliferative cells in PTZ-treated animals appeared to enter the brain from the circulation via leptomeningeal blood vessels (F, arrow points to a mitosis-like state). (G, H): Quantitation of BrdU-positive cells. One episode of convulsive seizure causes, at day 3, dramatically increased BrdU-positive cell numbers in the hippocampus (15-fold over controls; p = 0.001) (G) and temporal neocortex (22.5-fold over controls; p = 0.001) (H). Although the numbers of BrdU-positive cells decreased dramatically by day 25, their number remained, nonetheless, at relatively high levels in the hippocampus (4.8-fold; p = 0.001)(G) and temporal neocortex (5.6-fold; p = 0.001) (H) over control levels. N = 15 rats for each timepoint. Abbreviations: Te-II, temporal neocortex layer II; Ent, entorhinal neocortex; HC, hippocampus; lep, leptomeninx. Bars: (C, D, E), 20 µm; (F), 30 µm.

