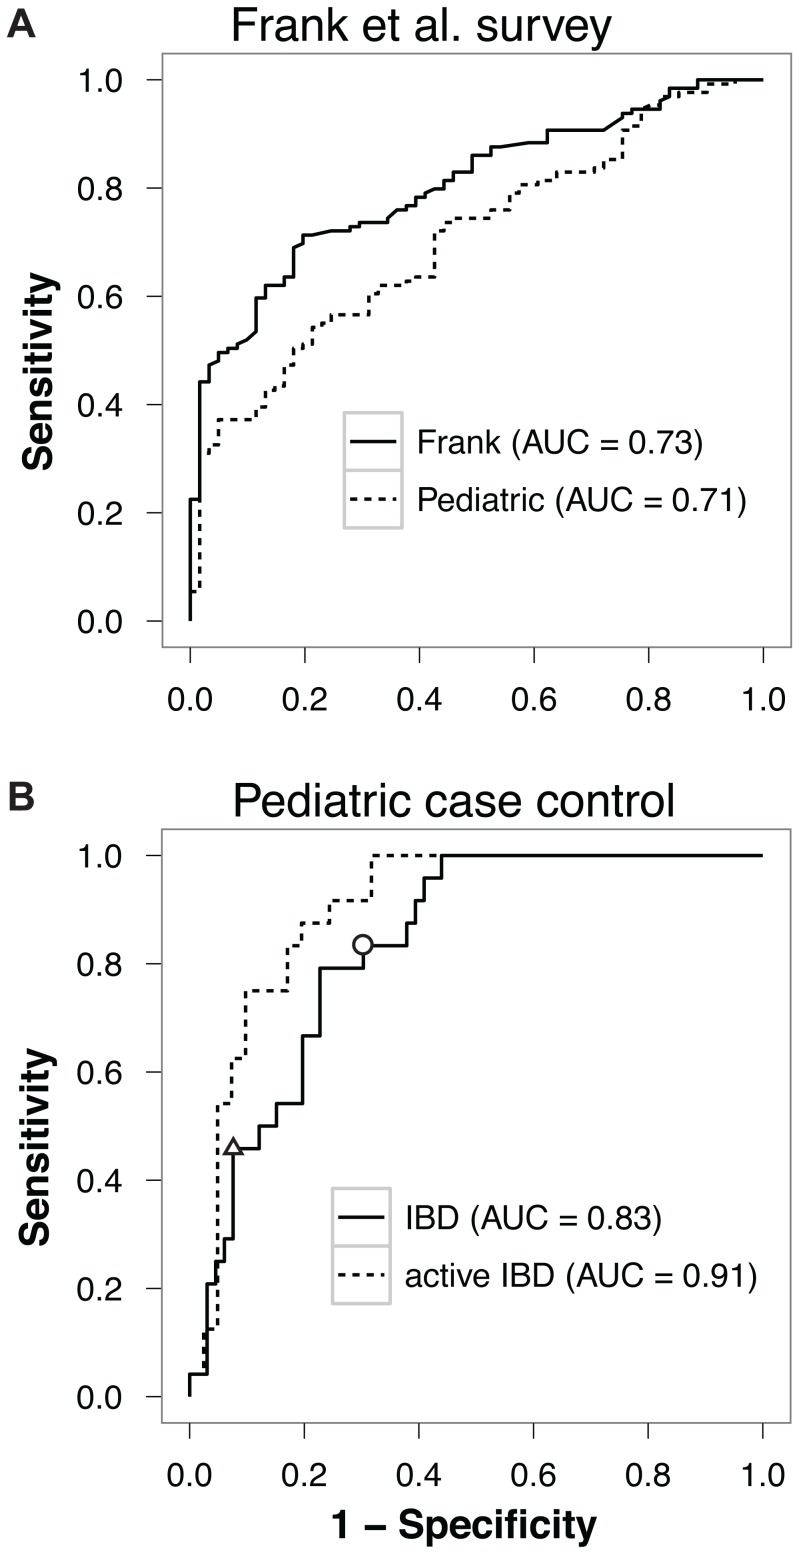
Figure 1. Accuracy of disease classification.
(A) SLiME applied to Frank et al. biopsy data set. The black line indicates performance obtained when features were generated by taxonomical binning of the original sequence data (AUC = 0.73); dashed line shows performance when features were selected based on their importance in the pediatric case-control data set and then applied to the Frank et al. study (AUC = 0.71). (B) ROC curve for SLiME classification of active IBD patients vs controls in the pediatric case-control data set. Two different threshold selections are highlighted: circle, for which SLiME has 80.3% sensitivity and 69.7% specificity; triangle, for which SLiME has 45.8% sensitivity and 92.4% specificity.

