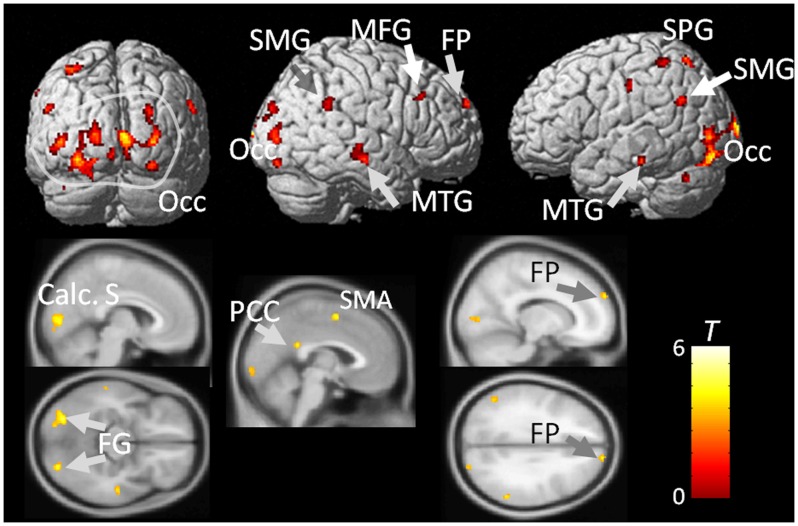
Figure 2. Brain images of neural activity in response to the observation of the object-related hand movement task for risk-taking actions vs. safe actions.
Statistical threshold for illustrating the clusters was p<0.001 uncorrected. The bar on the right shows the range of t scores for statistical parametric mapping. Calc. S, calcarine sulcus; FG, fusiform gyrus; FP, frontal pole; MFG, middle frontal gyrus; MTG, middle temporal gyrus; Occ, occipital cortex; SMA, supplementary motor area; SMG, supramarginal gyrus; SPG, superior parietal gyrus.

