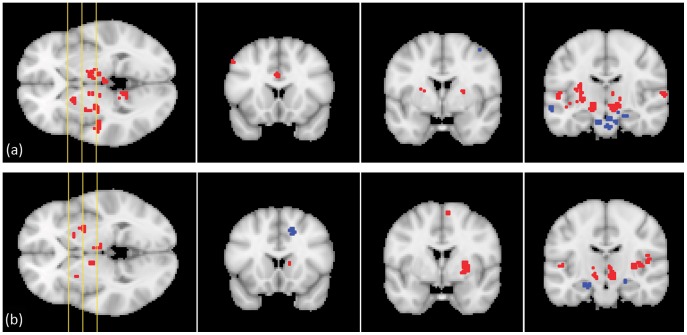
Figure 6. Significant functional connectivity clusters for (a) the right and (b) the left atlas-based STN ROIs, shown on three coronal slices of the MNI152 template.
The yellow lines on the axial image on the left-hand side show the position of the coronal slices. Red clusters exhibit positive regression coefficients, while blue clusters yield negative coefficients.

