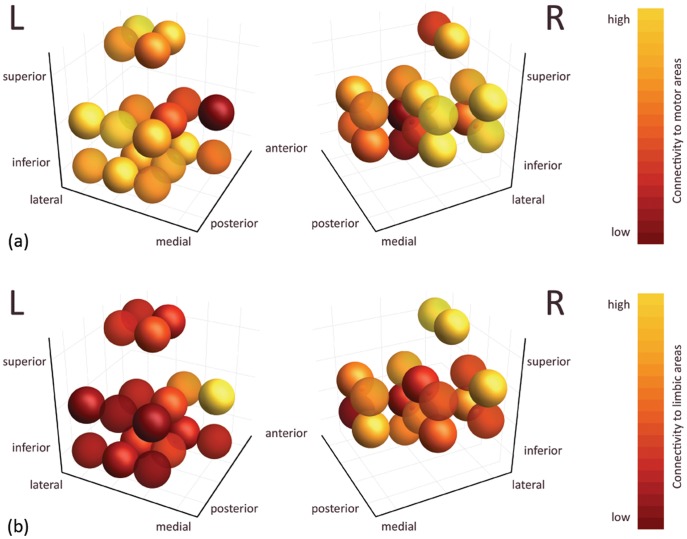
Figure 7. Functional connectivity per STN voxel in atlas space after applying the reverse regression procedure.
(a) Connectivity to motor areas per voxel of the left and right STN, cumulated over all subjects. (b) Connectivity to limbic areas per voxel of the left and right STN, cumulated over all subjects. Each sphere in (a) and (b) represents one voxel and is color-coded by functional connectivity: dark red means low connectivity, while yellow means high connectivity.

