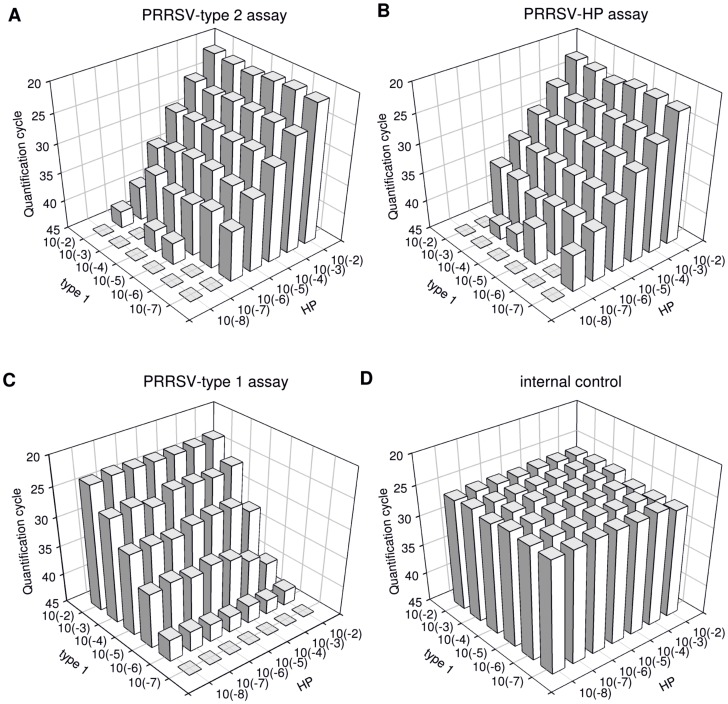
Figure 2. Chequerboard titration of a type 1- and a HP-PRRSV strain.
Cq-values (z-axis) of the type 2- (2a) and HP- (2b) specific assays while co-amplification of different concentrations of the type 1 strain (y-axis) are shown. 2c depicts results of the type 1-specific assay when co-amplifying varying concentrations of HP-specific sequences (x-axis). Cq-values of the internal control RT-qPCR are shown in figure 2d. Images were designed supported by SigmaPlot® software.

