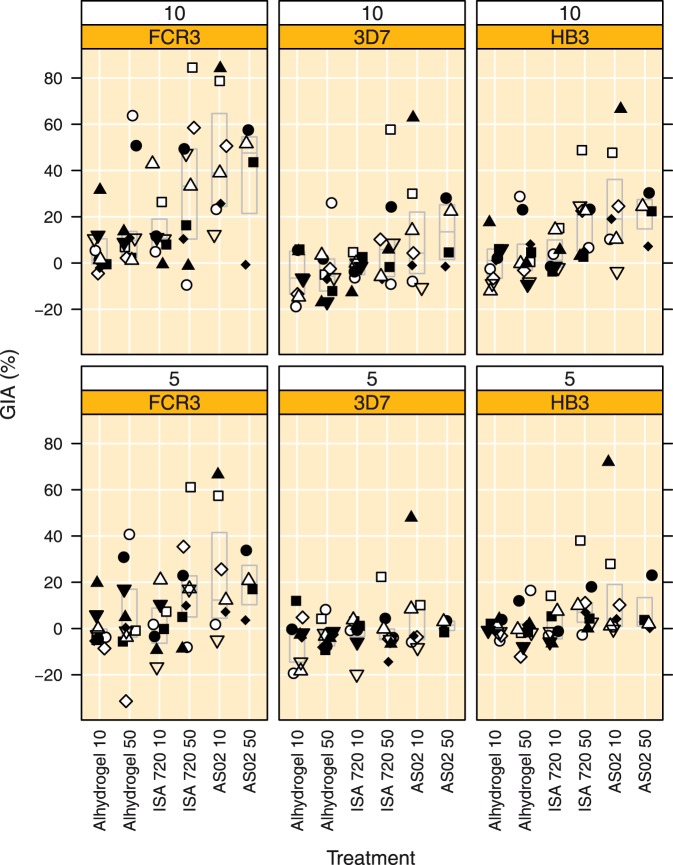
Figure 7. GIA to 3 laboratory strains (FCR3, homologous and 3D7 and HB3, heterologous) at 10 and 5 mg mL−1 total IgG obtained at day 84.
Top row: GIA at 10 mg mL−1 and bottom row GIA at 5 mg mL−1 IgG. Boxes indicate median and quartile ranges. Treatment groups are indicated by Adjuvant name and AMA1 dose, respectively.

