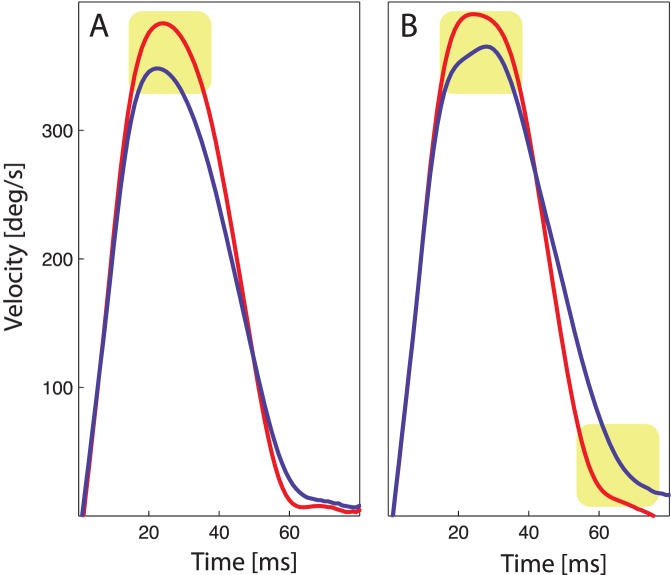
Figure 3. Absolute changes in velocity profiles.
Absolute changes in saccade profiles for inward adaptation (A) and outward adaptation (B). The overall subjects average of saccadic eye velocity of the first four trials in red is compared to the average eye velocity of the last four trials in blue. On the x-axis the time from saccade start is depicted, on the y-axis the eye velocity. Areas of peak velocity decay and duration increase are marked with a yellow background shading.

