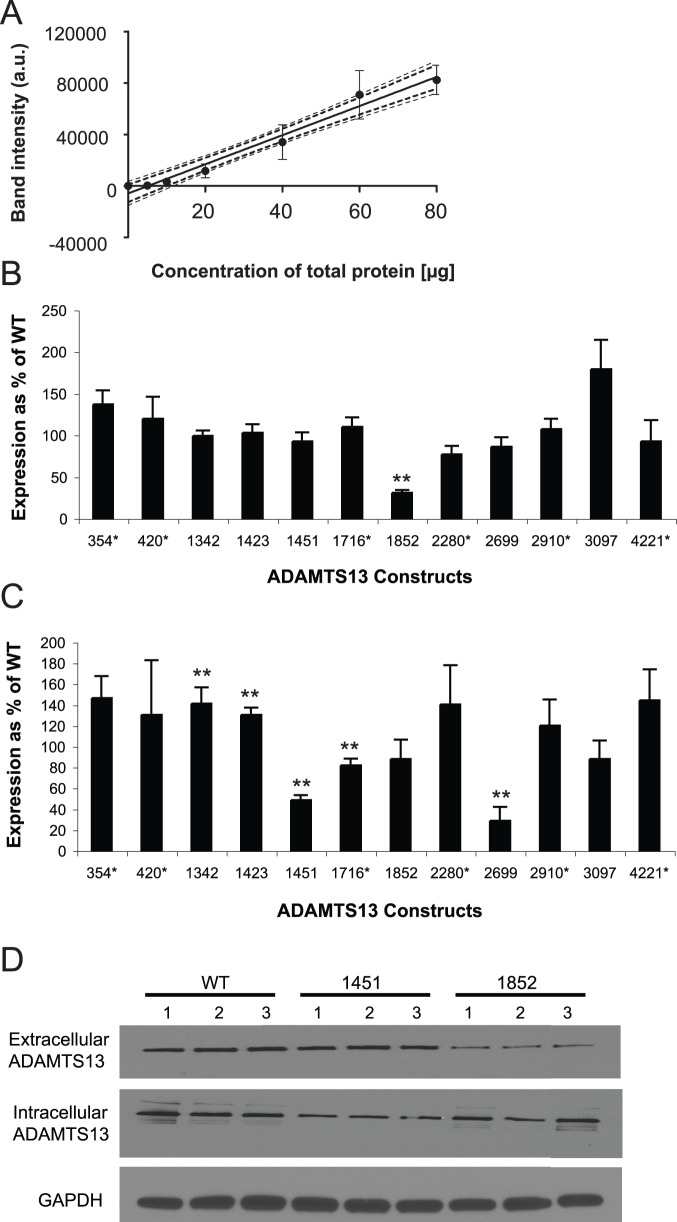
Figure 2. Ex vivo analysis of expression levels of ADAMTS13 variants. A.
Western blotting data revealing linear dependence between the amount of the loaded protein and the western signal: Media was collected and concentrated 24 h. post-transfection. Increasing amounts of total protein (5, 10, 20, 40, 60 and 80 µg) were subjected to SDS-PAGE analysis. Anti-V5 antibody was used to detect ADAMTS13 and densitometry analysis was performed as described in Materials and Methods. The dashed bolded lines indicate 95% confidence limits and the dashed non-bolded lines represent 90% confidence limits. B. Extracellular ADAMTS13 Expression (based on immunoblot analysis). Expression results for each variant are presented relative to WT. Multiple independent transfection experiments utilizing each variant and WT ADAMTS13 construct were performed (**p-value <0.05). C. Intracellular ADAMTS13 Expression (based on immunoblot analysis): GAPDH and/or β-actin were used as loading controls (not shown). Expression results for each variants are presented relative to WT. Multiple independent transfection experiments utilizing each variant and WT ADAMTS13 construct were performed as above (**p-value <0.05). D. SDS-PAGE immunoblot analysis of ADAMTS13 WT, non-synonymous variants 1451 (Arg>Lys) and 1852 (Pro>Ala) expression levels using anti-V5 antibody: Top – extracellular ADAMTS13, middle – intracellular ADAMTS13 and bottom - GAPDH loading control. ADAMTS13 variants harboring synonymous variants are marked with (*).

