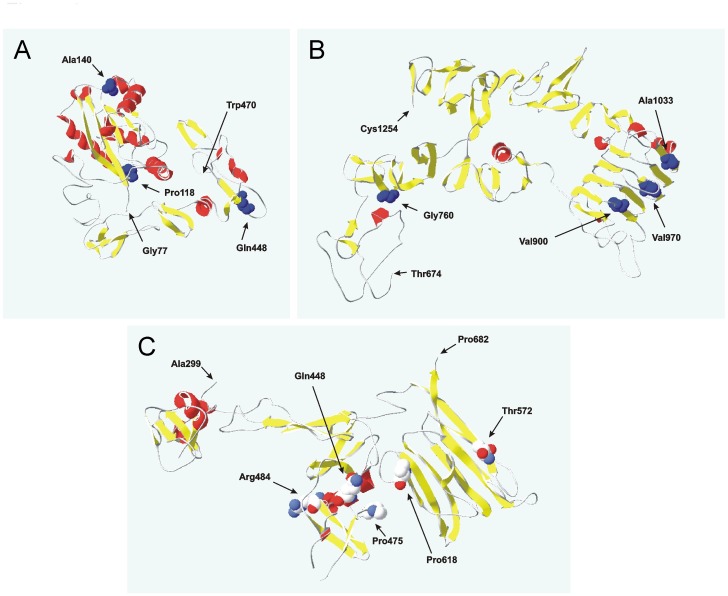
Figure 4. Ribbon diagrams of the ADAMTS13 fragments.
Two upper panels: Left - comprising residues (77–470) and right (674–1254) built using comparative modeling (3D-PSSM algorithm). Bottom panel ADAMTS13 X-ray structure residues (287–682) PDB ID 3GHM. Helices are depicted in red and beta-structures are in yellow. Residues encoded by codons/variants under investigation are denoted with residue number (van der Waals’ radii of the side chains are shown). Beginning and end of each fragment are also denoted with a residue number.

