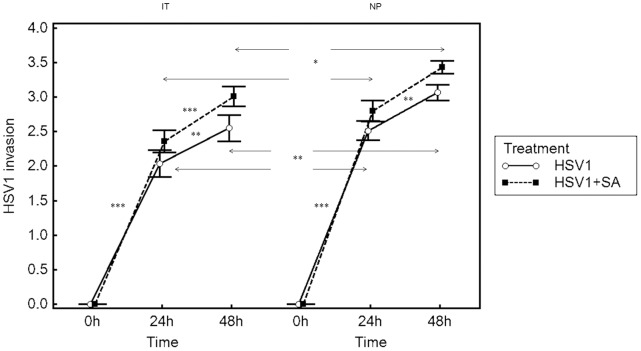
Figure 2. Invasion of nasal mucosa of inferior turbinate (IT) and nasal polyp tissue samples (NP) by HSV1.
Results are presented as mean scores ± SEM for IT from 10 patients and NP from 7 patients. Arrows represent differences between HSV1-infection and HSV1+S. aureus-infection groups or differences between IT group and NP groups. *P<0.05, **P<0.01 and ***P<0.001.

