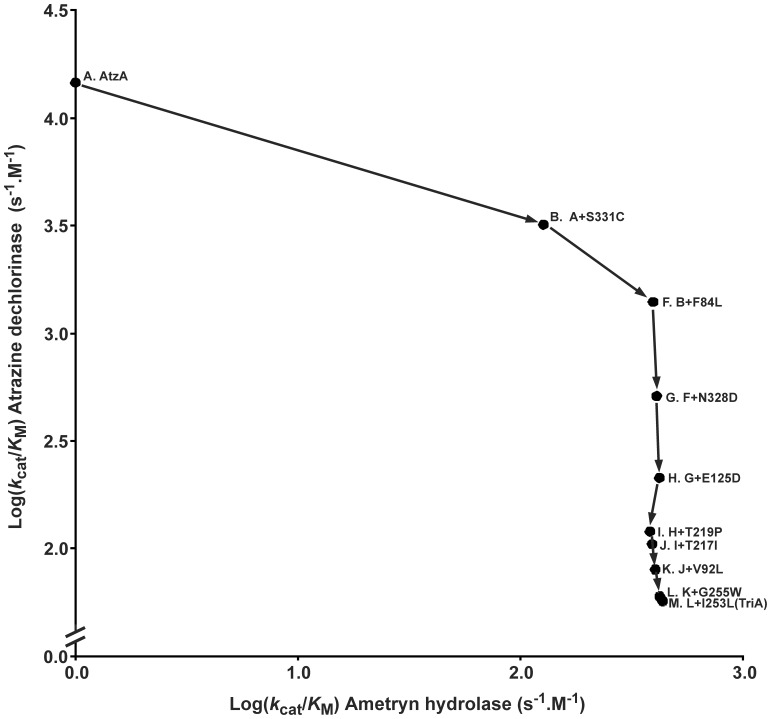
Figure 5. Trade-off between atrazine dechlorinase and ametryn hydrolase activity during the transition between AtzA and TriA.
Circles indicate the variants for which the k cat/K M values (s−1.M−1; values in Table 1 and Table S2) for atrazine dechlorination and ametryn hydrolysis are shown. Lines are used to link variants differing by a single amino acid. Each variant has been assigned a letter and the identity of the each variant’s direct parent is indicated together with the distinguishing amino acid substitution. The letter assignments correspond to those found in Fig. 3 and Table 1.

