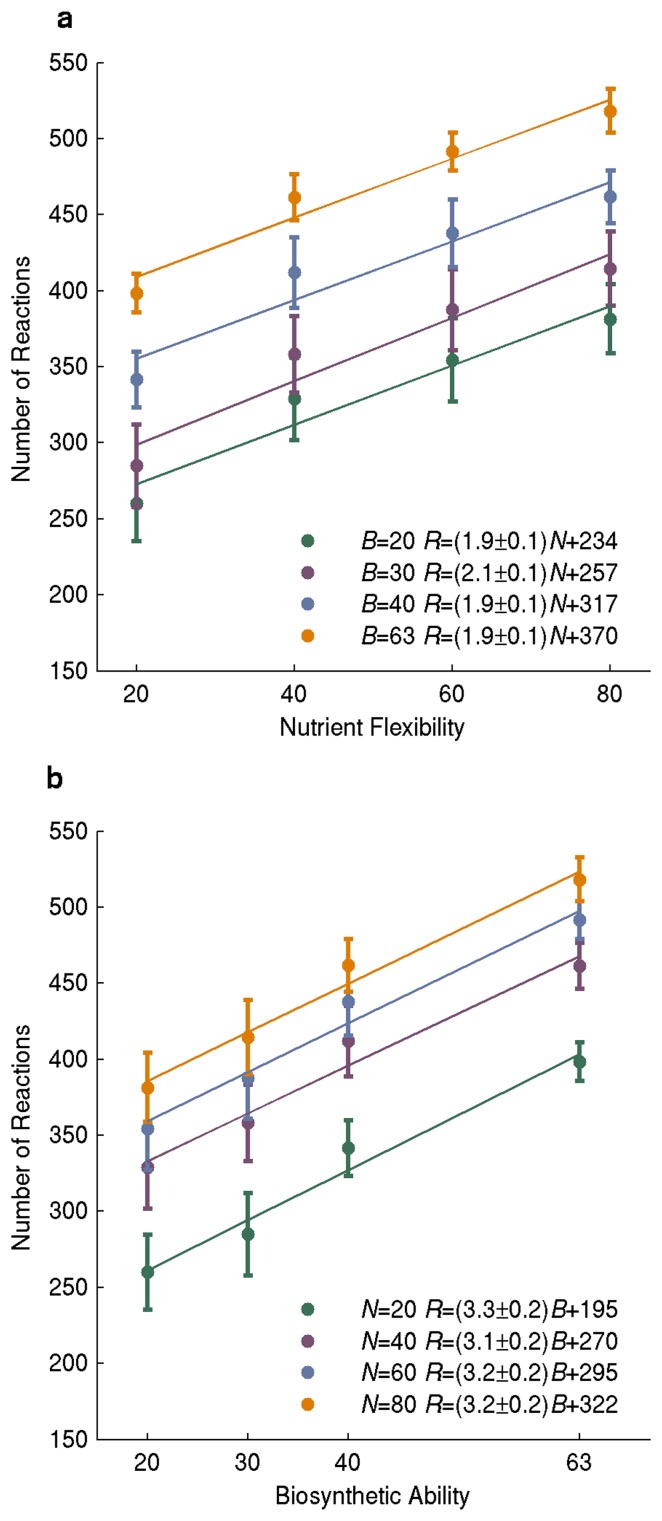
Figure 1. The number of required reactions increases with nutrient flexibility and biosynthetic ability.
The vertical axis shows the number of reactions in minimal networks as a function of a) nutrient flexibility and b) biosynthetic ability. Dots and length of error bars correspond to means and one standard deviation based on a sample of n = 50 minimal networks. Solid lines indicate linear regression lines for different values of B in a) and N in b). Numerical estimates of regression coefficients with 95% confidence intervals are given in the inset, in the format y = (a±e)x+b, where a is the regression coefficient, e the confidence interval, and b is the intercept of the regression line with the vertical axis.

