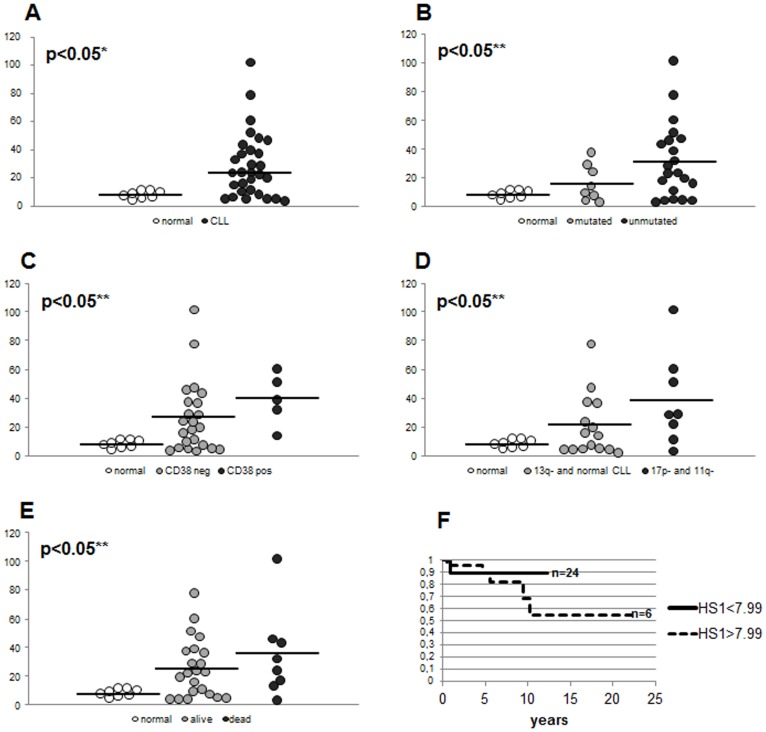
Figure 2. Expression of HS1 mRNA in CLL B lymphocytes.
RNA extracted from normal B lymphocytes and leukemic B cells from CLL patients were analyzed for HS1 expression and normalized on GAPDH. Figure 2A shows HS1 mRNA expression of 30 CLL patients and 8 normal controls. Data obtained were evaluated for their statistical significance with the Student’s t-test (* p<0.05 between normal controls and CLL patients, A) or ANOVA (** p<0.05 between normal vs mutated CLL vs unmutated CLL, B; normal vs CD38 neg CLL vs CD38 pos CLL, C; normal vs 13q- and normal karyotype CLL vs 17p- and 11q- CLL, D; normal vs still alive patients vs dead patients, E). Medians are represented by solid lines. Figure 2F represents the overall survival comparison between patients (n = 8) presenting high levels of HS1 mRNA (HS1>7.99, dotted line) and patients (n = 26) presenting low levels of HS1 mRNA (HS1<7.99, solid line); 7.99 is the median of HS1 levels in normal controls.

