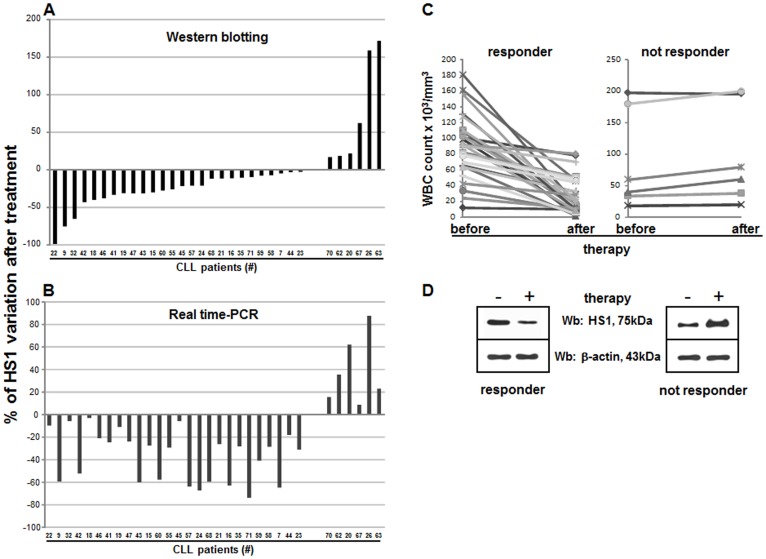
Figure 3. Effect of in vivo therapy with FLU and Cy on HS1 protein.
The lysates obtained from leukemic B cells (5×10⁵ for sample) from 32 patients subject to FLU-Cy therapy were analyzed by immunostaining with antibodies against HS1 and β-actin before (-) and after (+) the administration of FLU and Cy according to FLU-Cy protocol. The same cells were processed for RNA extraction, reverse transcription in cDNA and amplification of HS1 and GAPDH by Real-Time PCR. (A) Histograms represent HS1 percentage of variation measured by western blotting analysis. (B) Histograms represent HS1 percentage of variation measured by using Real-Time PCR. (C) Graphics reports WBC count before and after therapy in responsive (left) and unresponsive (right) patients; the reduction of WBC count underlines the responsiveness to therapy. (D) The western blot in the left panel is representative of 26 patients who responded to therapy; right panel is representative of 6 patients not responding to therapy. Cy, cyclophosphamide; FLU, fludarabine.

