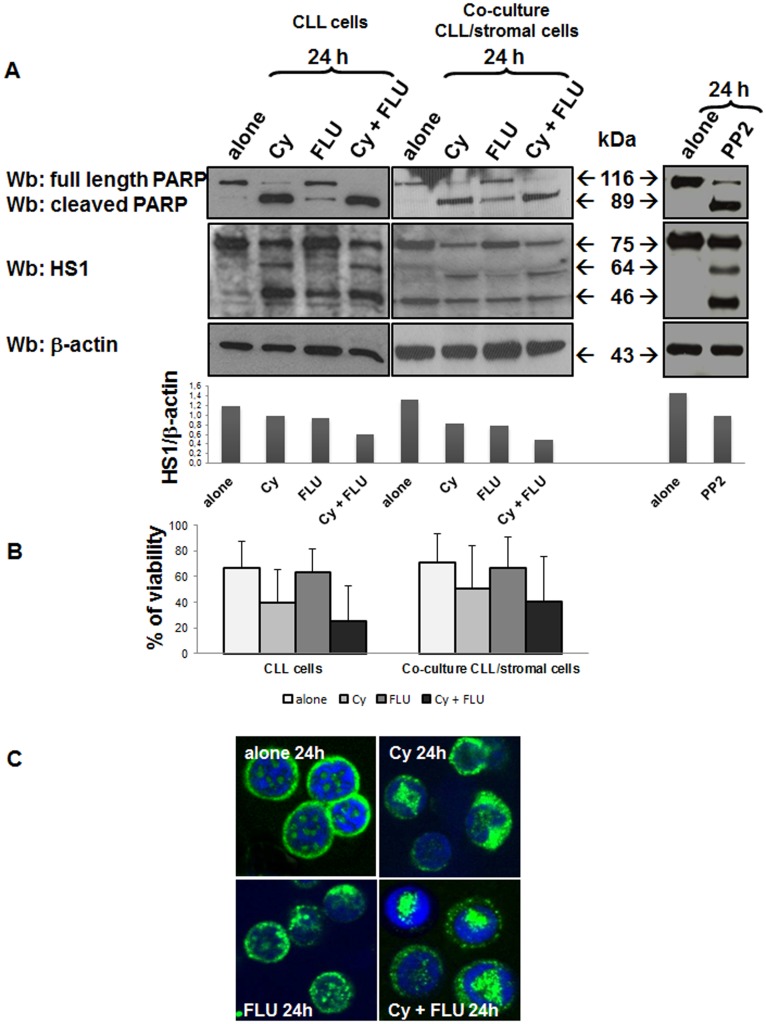
Figure 4. Effect of in vitro treatment with FLU and Cy on HS1 protein.
(A) CLL cells were cultured for 24 hours alone or in presence of Cy (5 mM), FLU (20 µM) and Cy and FLU together (left panel), with the same drugs but in co-culture with the HS-5 stromal cell line (panel in the middle) or with PP2 (20 µM) (right panel). Subsequently, cells were processed for SDS/PAGE, transferred on nitrocellulose membrane and treated with polyclonal anti-PARP antibody, to put in evidence cell apoptosis, anti-HS1 polyclonal and anti-β-actin. Histograms represents full length HS1/β-actin ratio densitometric analysis. (B) Cell viability under the same conditions of point A was assessed by Annexin/PI test; histograms represent the mean±SD of percentage of cell viability of 8 CLL patients samples cultured alone (histograms on the left) or in co-culture with stromal cells (histograms on the right). (C) Confocal microscopy analysis of HS1 (FITC, green) in leukemic B lymphocytes cultured 24 hours alone or in presence of Cy, FLU and Cy and FLU together; nuclei were stained with DAPI (blue). UltraView LCI confocal system, UltraView LCI 5.0 acquisition software; original magnification, ×60. Cy, cyclophosphamide; FLU, fludarabine.

