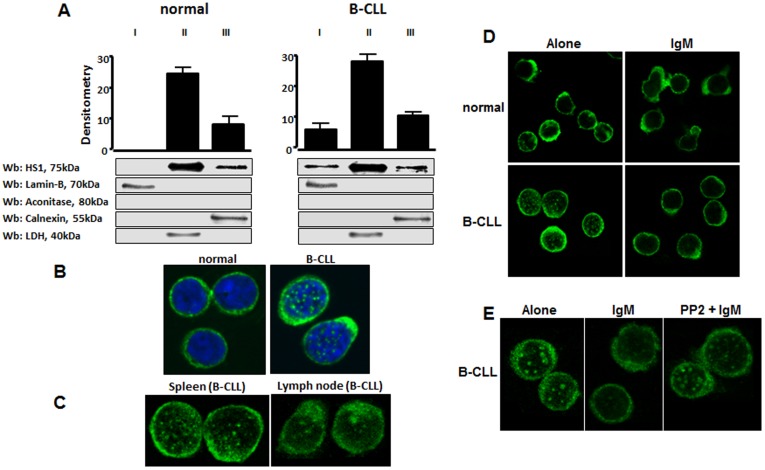
Figure 5. Subcellular localization of HS1 in normal and CLL B cells.
(A) Analysis by differential ultracentrifugation. B cells were sonicated in isotonic buffer and nuclei (I), cytosol (II) and microsomes (III) were separated by ultracentrifugation. Comparable aliquots of the different fractions were loaded on SDS/PAGE and the separated proteins were immunostained with anti-HS1 antibody, anti-LDH (cytosolic marker), anti-calnexin (endoplasmic reticulum marker), anti-PMCA (plasma membrane marker), anti-lamin-B (nuclear marker) and anti-aconitase (mitochondrial marker) antibodies. Figure is representative of different experiments performed on 10 CLL patients and 5 normal controls. The diagram shows the mean ± SD of HS1 of all the samples examined. (B) Confocal microscopy analysis of HS1 (FITC, green) in normal and leukemic B lymphocytes obtained from peripheral blood; nuclei were stained with DAPI (blue). The analysis of HS1 immunolocalization was performed in 6 different normal and 15 CLL samples. (C) Confocal microscopy analysis of HS1 (FITC, green) in leukemic cells from spleen and lymph node of a CLL patient. (D) Confocal microscopy analysis of normal and leukemic B lymphocytes after incubation alone or with anti-human IgM (10 µg/ml) for 10 minutes at 37°C for BCR activation. Cells were immunostained with anti-HS1 antibody (FITC, green). (E) The same experiment of point D was performed in CLL lymphocytes pre-incubating cells with the Lyn kinase inhibitor PP2 (10 µM). The figure is representative of the experiments performed in 4 CLL patients. UltraView LCI confocal system, UltraView LCI 5.0 acquisition software; original magnification, ×60.

