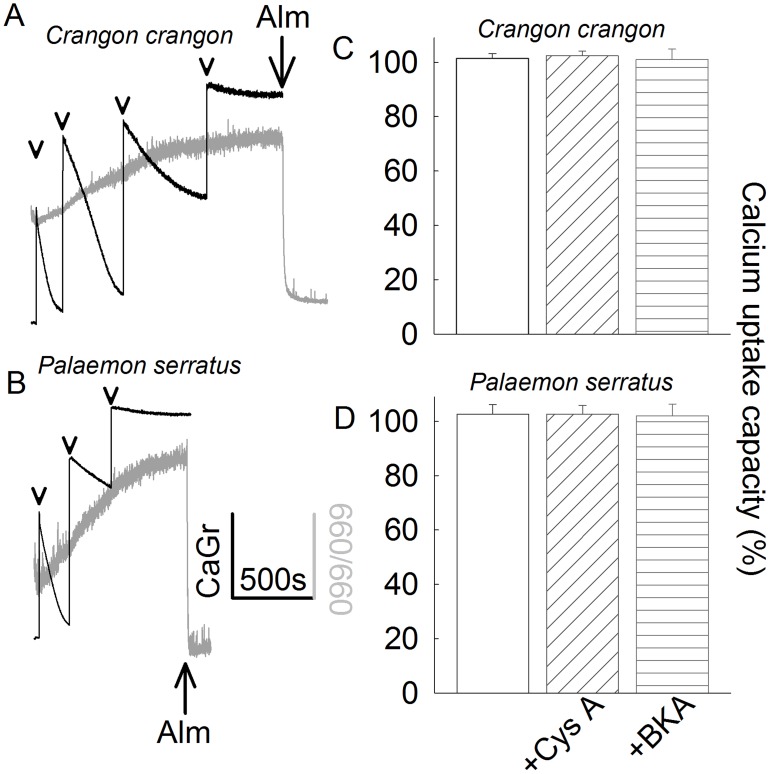
Figure 1. Characterization of Ca2+ retention of Crangon crangon (A, C) and Palaemon serratus (B, D) mitochondria. A, B.
: Time courses of CaGr-5N fluorescence (arbitrary units, black traces) reflecting extramitochondrial [Ca2+], in parallel to light scattering at 660/660 nm (arbitrary units, grey traces), reflecting mitochondrial swelling. 200 µM CaCl2 was added where indicated by the arrowheads. 40 µg of alamethicin (Alm) was added where indicated. Results shown in panels A and B are representative of at least 4 independent experiments. C, D: Bar graphs of maximum Ca2+ uptake capacity (% scale) calculated from the number of 100 µM CaCl2 additions given to mitochondria until no further decrease in CaGr-5N fluorescence (implying maximum mitochondrial calcium uptake) was observed, in the presence of 1 µM cyclosporin A or 20 µM BKA, (n = 3). The rates of Ca2+ uptake of the last addition were compared among treatment groups, where it exhibited a small variability, but no statistical significance (p = 0.933 for Crangon crangon and p = 0.989 for Palaemon serratus, ANOVA on Ranks). The rates of Ca2+ uptake of all previous CaCl2 additions were virtually identical among all treatment groups.

