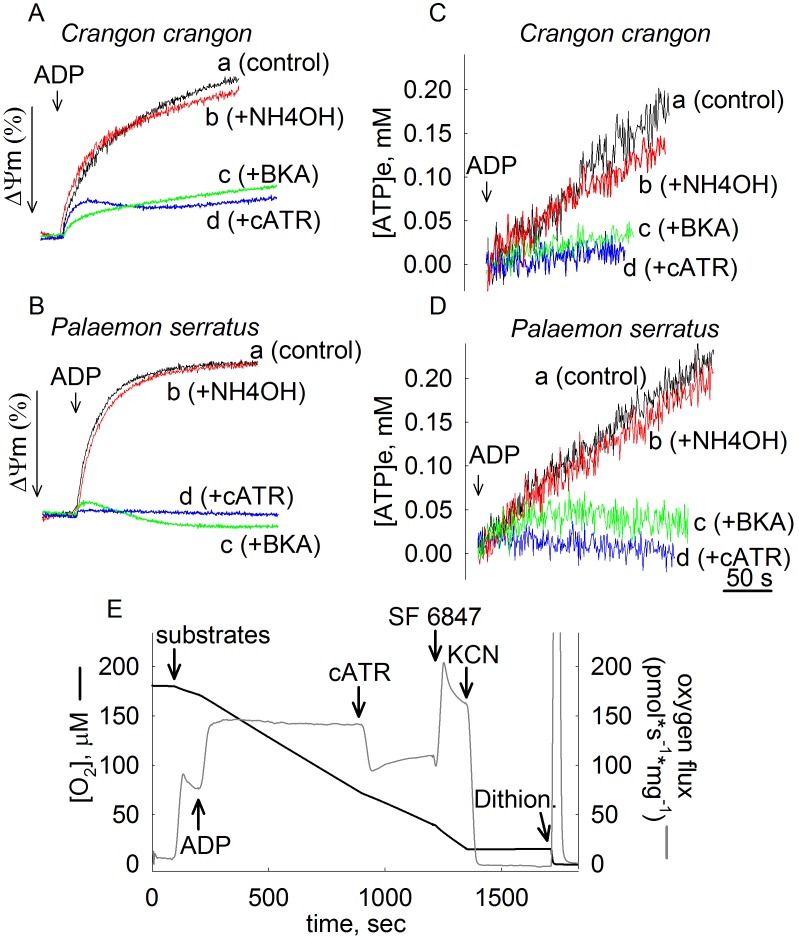
Figure 3. Effect of ANT ligands on ADP-induced alterations in ΔΨm and ADP-ATP exchange rates in Crangon crangon (A, C) and Palaemon serratus (B, D) mitochondria.
A, B: Time courses of safranine O fluorescence reflecting ΔΨm (% scale). Maximum (100%) polarization is the value of safranine O fluorescence prior to the addition of ADP; minimum (0%) polarization is the value of safranine O fluorescence after the addition of 1 µM SF6947 (omitted from the graph). The length of the arrow representing ΔΨm in the y-axis is equal to a 10% change. C, D: Reconstructed time courses of extramitochondrial [ATP] appearing in the medium upon addition of ADP (where indicated), and effect of mitochondrial inhibitors. Vehicle of BKA (2 mM NH4OH, traces b), bongkrekic acid (BKA, 20 µM, traces c), or carboxyatractyloside (cATR, 1 µM, traces d) were present prior to the addition of ADP. In trace a no inhibitor was present prior to the addition of ADP. E: Characterization of oxygen consumption of Palaemon serratus mitochondria. Black trace represents a time course of oxygen consumption, by 0. 5 mg Palaemon serratus mitochondria suspended in a 2 ml volume. Grey trace represents the negative time derivative of oxygen concentration, divided by mitochondrial mass per volume. Additions of substances are indicated by arrows. ADP: 0.2 mM. cATR: 2 µM. SF 6847: 1 µM. KCN: 1 mM. Dithion.: Dithionite (added in excess). Substrates were glutamate and malate and succinate (5, 5, and 5 mM). Results shown in all panels are representative of at least 4 independent experiments.

