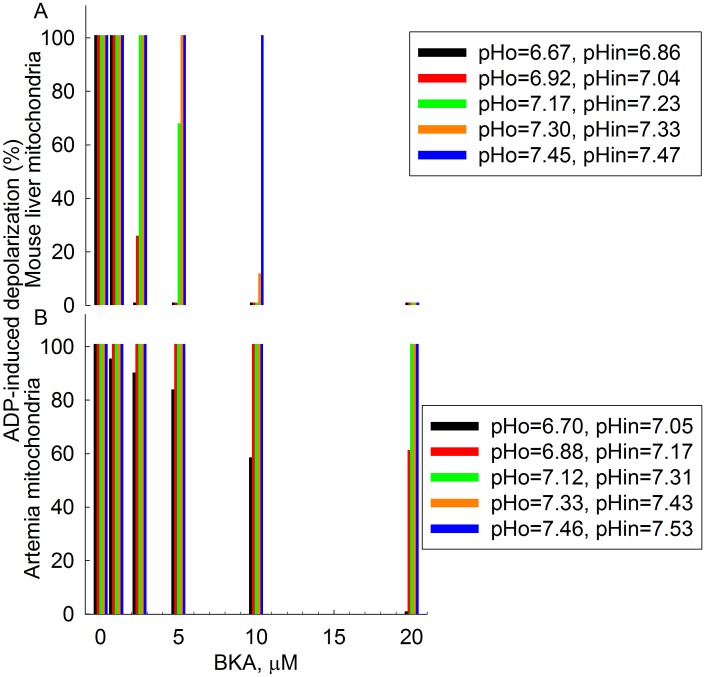
Figure 4. ADP-induced depolarization (% values) in mouse liver (A) and Artemia cyst (B) mitochondria subjected to various pHo, as a function of BKA concentration (0, 1.25, 2.5, 5, 10 and 20 µM). In the insets to the right the values of pHin as a function of pHo is shown.
Data represent a representative experiment (from three independent experiments) performed in a single run. Experimental data were not pooled in order to be presented as a bar graph with SE bars because pHo showed a slight variation among different experiments.

