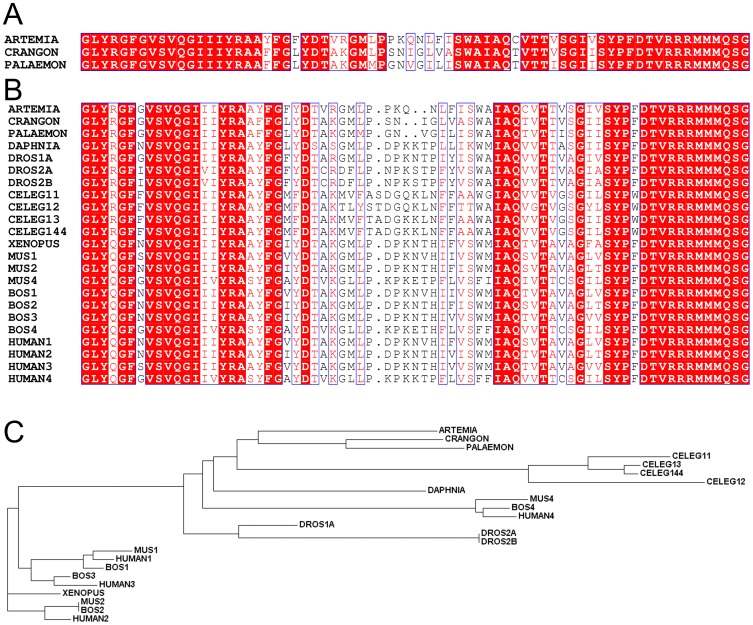
Figure 5. Multiple sequence analysis of the ANT expressed in various organisms and their position in the phylogenetic tree. A:
Alignment of predicted primary amino acid sequences (in single-letter code) of ANT (partial sequence) expressed in Artemia cysts, Crangon crangon and Palaemon serratus. B: Alignment of predicted primary amino acid sequences expressed in various organisms (partial sequences). DAPHNIA: Daphnia pullex; DROS: Drosophila melanogaster; CELEG: C. elegans; XENOPUS: Xenopus laevis; MUS: Mus musculus; BOS: Bos Taurus. Numbers after each abbreviation indicates isoform. ‘11’, ‘12’, ‘13’ and ‘144’ indicate isoforms 1.1, 1.2, 1.3 and 1.44, respectively. Conserved regions are highlighted in red. C: Cladogram based on the sequence alignment shown in panel B for the same organisms.

