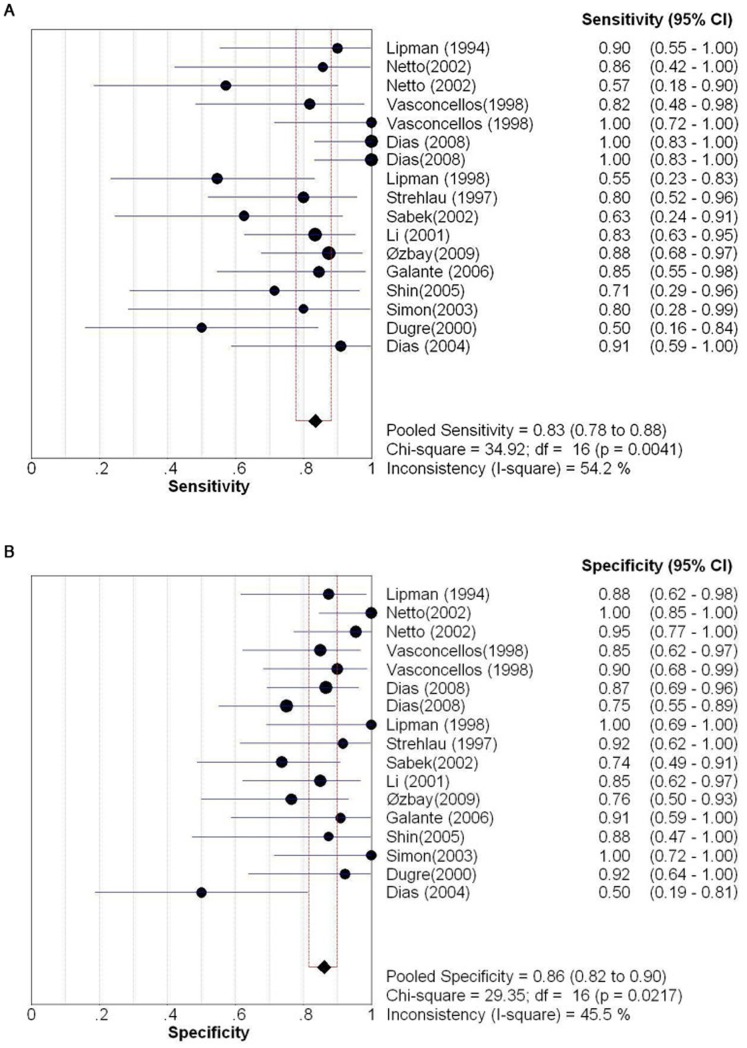
Figure 2. Sensitivity and specificity of perforin mRNA detection for the diagnosis of AR.
(A) Pooled sensitivity. (B) Pooled specificity. Effect sizes were pooled by random-effects models. The point estimates from each study are shown as solid squares. The pooled estimates are shown as a solid diamond. Error bars represent 95% CIs.

