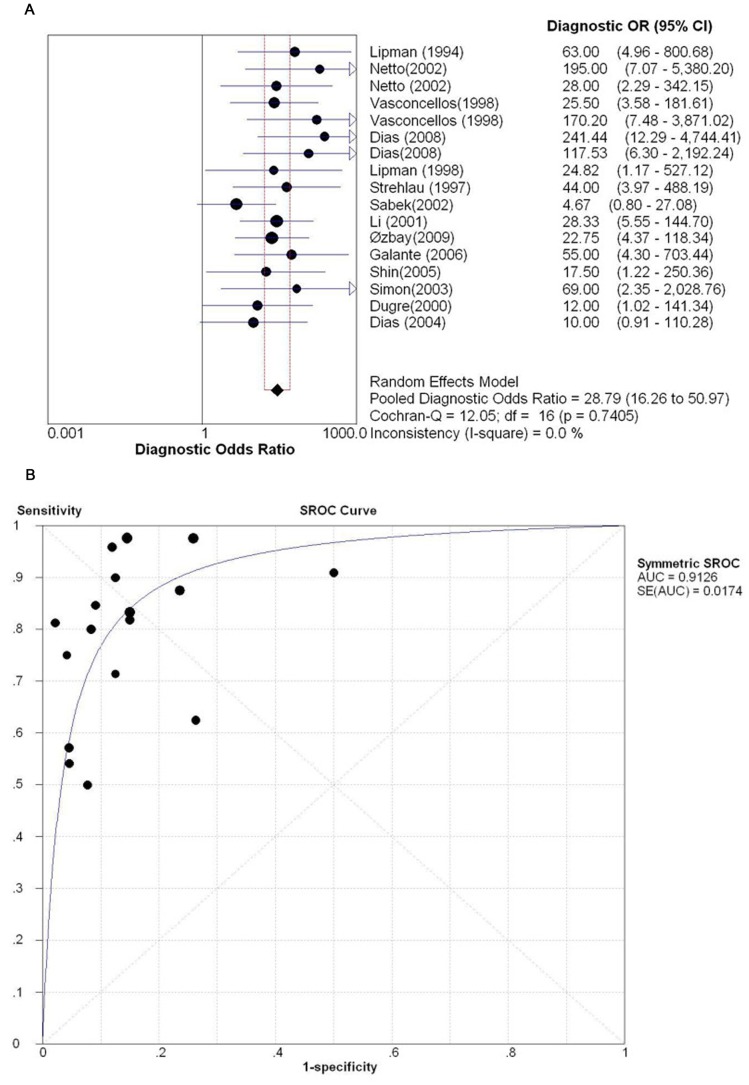
Figure 3. Overall DOR and SROC curves for all data sets describing the diagnostic performance of perforin mRNA detection in identifying AR.
(A) Overall DOR. (B) The SROC curves for all data sets. Effect sizes were pooled by random-effects models. The pooled DOR is shown as a solid diamond. Each square in the SROC curve represents one study. Sample size is indicated by the size of the square.

