
Figure 4. HMGB-1 and alpha-SKA expression in left ventricular myocardium.
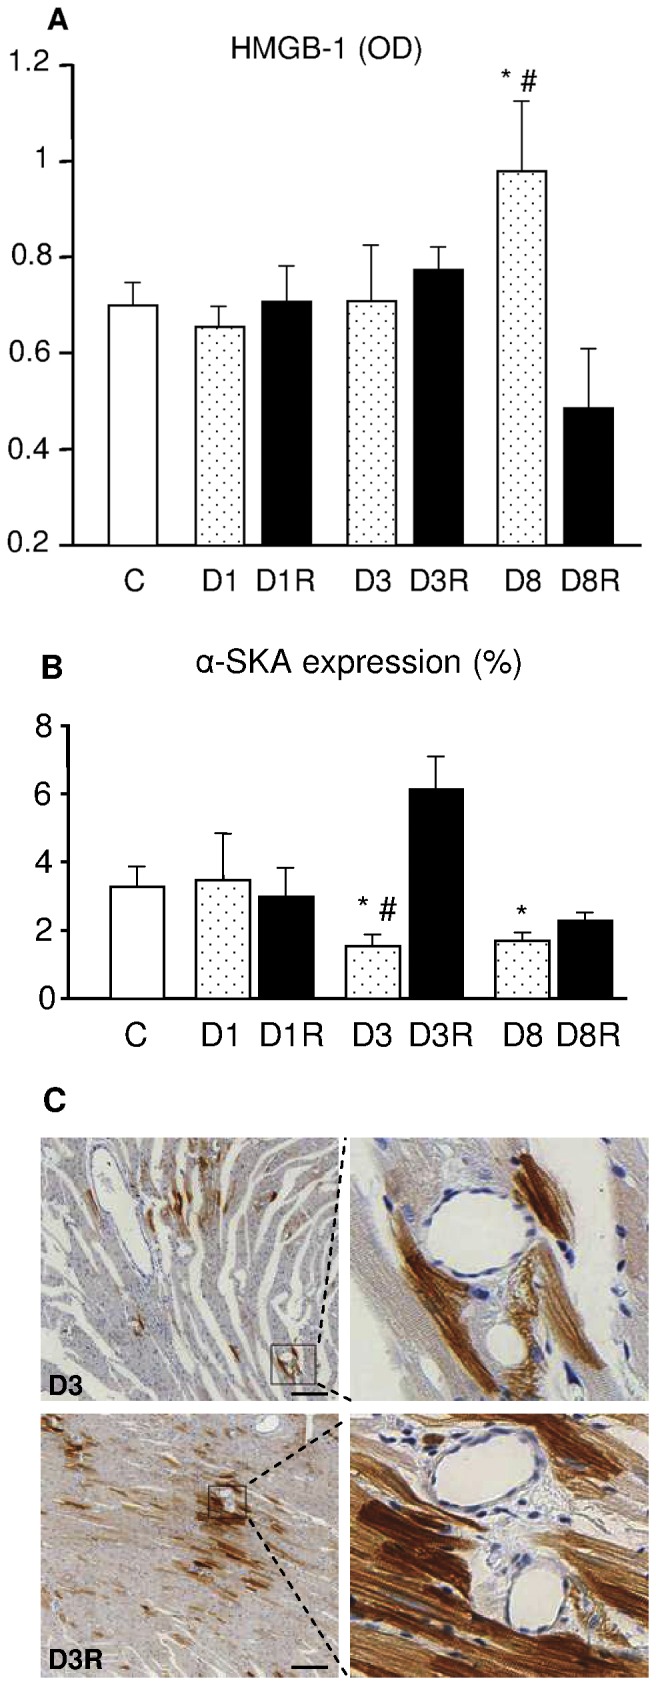
A–B: Expression levels of A) high mobility group box-1 protein (HMGB-1) and B) α-SKA, in left ventricular myocardial tissue. Data are reported as mean ± SE. * p<0.01: significant differences vs. C. # p<0.05: significant differences vs. the corresponding RSV-treated group. C: sections of D3 (upper panels) and D3R (lower panels) LV myocardium stained with anti α-SKA. Black squares inscribe an area shown at higher magnification in corresponding adjacent panels. Scale bar = 100 µm.