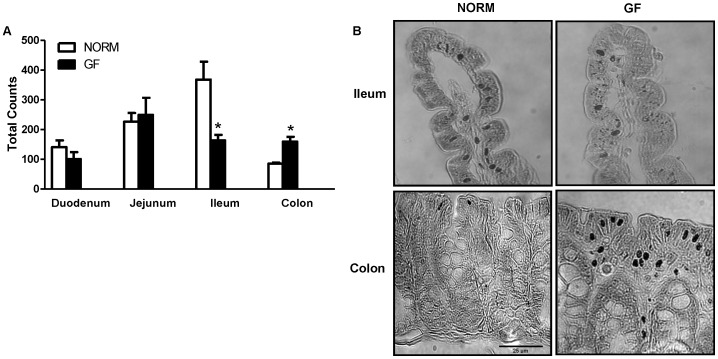
Figure 5. (A) Cell counts of enteroendocrine cells expressing chromogrannin-A and (B) representative microphotographs of ileum and colon sections at 100× magnification.
GF mice had significantly less enteroendocrine cells in the ileum, but more in the colon, compared to NORM controls. Data are expressed as means±SEM. *P<0.05, compared to NORM mice.

