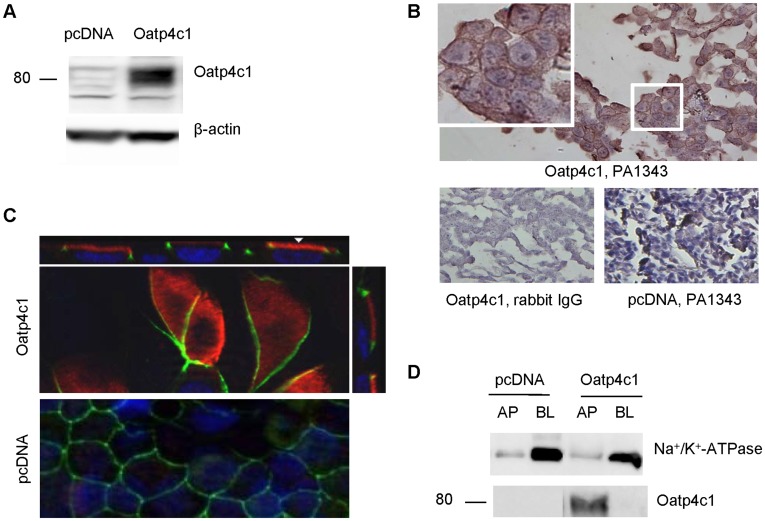
Figure 1. Validation of Oatp4c1 expression and subcellular localization in MDCKII cells.
(A) Western blot analysis for Oatp4c1 expression. Protein lysates (50 µg per lane) from MDCKII cells transfected with pcDNA (empty vector) and Oatp4c1 were prepared from cells grown in monolayers. (B) Immunohistochemical analysis for Oatp4c1 expression. Paraformaldehyde-fixed paraffin-embedded cell sections were stained with PA1343. Color development with NovaRed signifies Oatp4c1 staining. All sections were counterstained with hemotoxylin. Rabbit IgG was used as a negative control. (C) Immunolocalization of Oatp4c1 in polarized MDCKII cells. Cells were double stained with Oatp4c1 (red) and ZO-1 (green). Nuclei were stained with DAPI (blue). Center image in the Oatp4c1 panel is a single optical section of the x–y plane while top and right images represent x–z and y–z planes, respectively, reconstructed from image stacks. The apical and basal sides can be demarcated by ZO-1 and the nuclei, respectively, in both x–z and y–z sections. (D) Western blot analysis of Oatp4c1 in proteins isolated from either the apical (AP) or basolateral (BL) membranes of polarized MDCKII cells. Surface proteins were isolated by biotin-streptavidin labeling on either the apical AP or BL compartment. Na+/K+-ATPase served as a BL marker to demonstrate the relative efficiency of AP and BL membrane separation. (Magnification (40×)).

