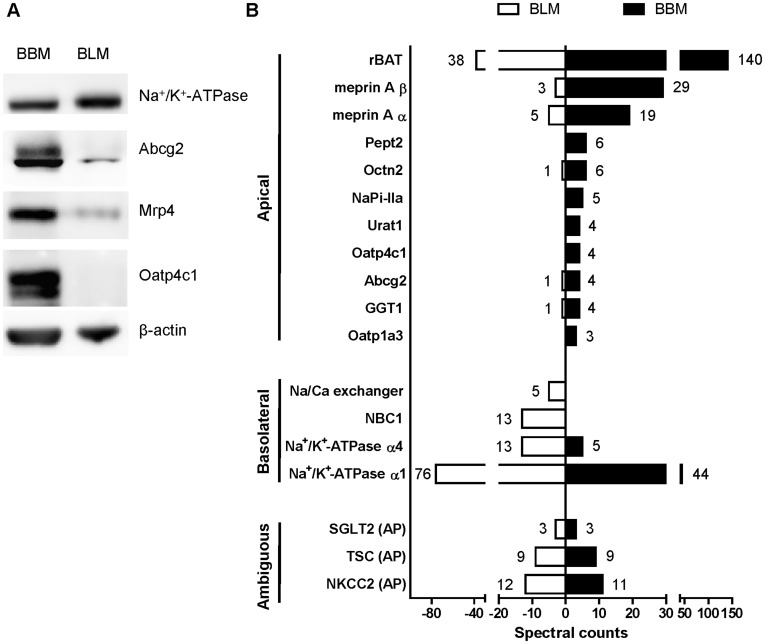
Figure 3. Expression of Oatp4c1 in isolated kidney brush border membrane (BBM) and basolateral membrane (BLM) fractions.
(A) Western blot analysis for Oatp4c1 expression in BBM and BLM. Biochemical separation of membrane proteins (20 µg per lane) from rat kidney cortex was achieved by Percoll gradient. Na+/K+-ATPase alpha 1 was used as a basolateral marker. Abcg2 and Mrp4 served as apical markers. Oatp4c1 was detected by PA1343. (B) LC-MS/MS based proteomic analysis of ∼60–150 kD proteins isolated from BBM and BLM fractions. Spectral counts detected in protein digests obtained from ∼60–150 kD sections excised from the SDS-PAGE gel. Proteins with 3 or more spectral counts in one fraction are presented as “Apical” or “Basolateral” based on previously published data. Spectral counts indicate the number of unique peptides detected in each fraction. (AP, apical).

