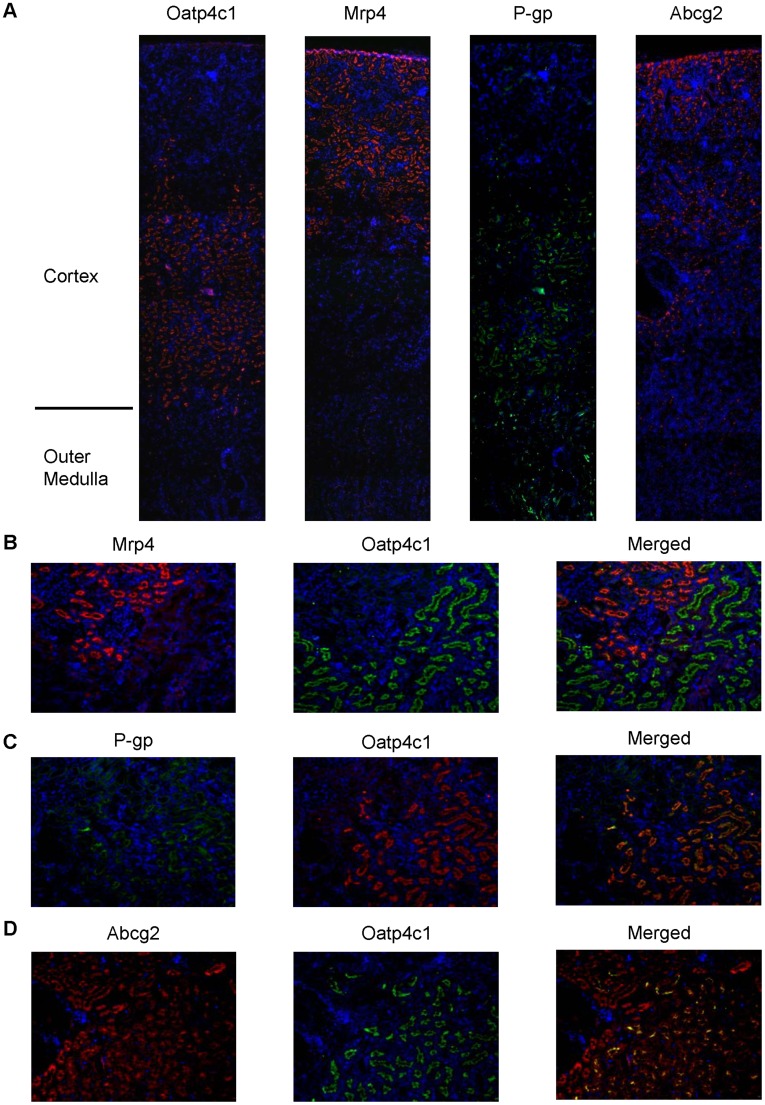
Figure 5. Oatp4c1 colocalization with major efflux transporters in the kidney cortex.
Paraformaldehyde-fixed paraffin-embedded rat kidney sections were stained for Oatp4c1 (red), Mrp4 (red), P-gp (green), and Abcg2 (red) (A). Sections were double stained for Mrp4 (red) and Oatp4c1 (green); (C) P-gp (green) and Oatp4c1 (red); and (D) Abcg2 (red) and Oatp4c1 (green) (B). Yellow/orange color in merged panels indicates colocalization. Nuclei (blue) were stained with DAPI. Images presented in panel 5A were stitched from six individual images using NIH Image J with Fiji plugin (Magnification: 4× (A), 10× (B–D)).

