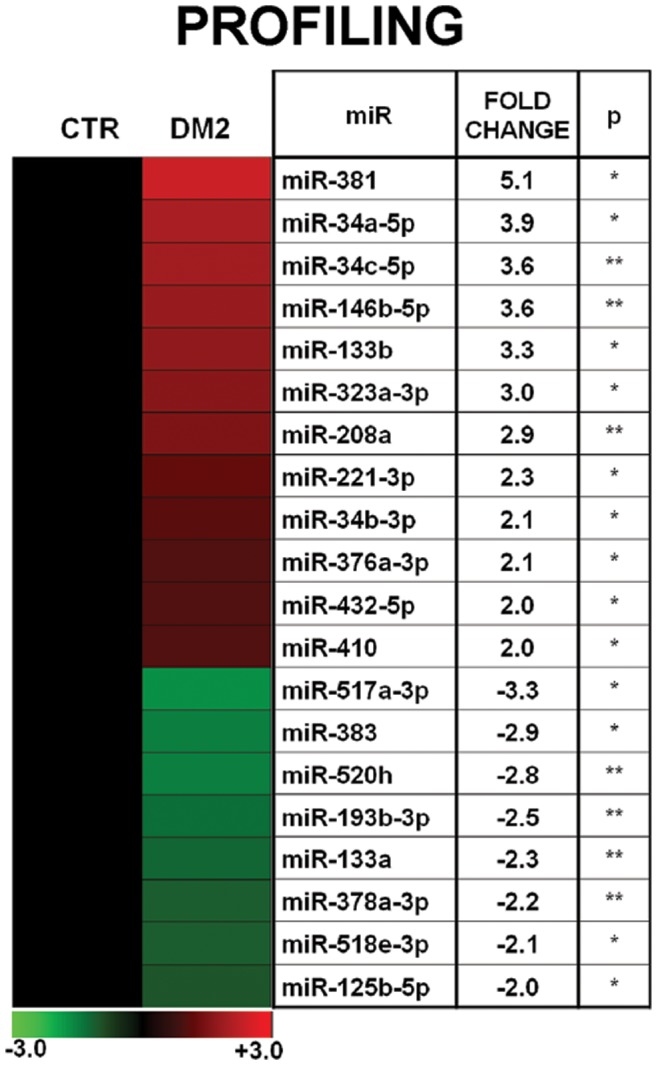
Figure 2. Profiling of miRNAs in DM2 patients and CTR.

In the heat map on the left, mean miRNAs expression values are shown in a log2 scale (-ΔΔCt), where red and green indicate positive and negative modulation respectively. The table on the right shows the same values in a linear scale (DM2 = 13, CTR = 13; *p≤0.05 **p≤0.01).
