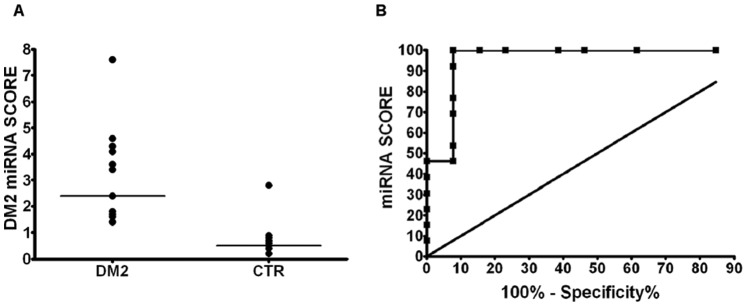
Figure 4. Discrimination between DM2 and control groups using the DM2 miRNA score.
(A) Dot plot of the DM2 miRNA score in DM2 patients and CTR. The segments among the dots indicate median values for each group and the difference is statistically significant (DM2 = 13, CTR n = 13; p<0.0001). (B) ROC curve displaying DM2 miRNA score discrimination between the DM2 and CTR groups (AUC = 0.96).

