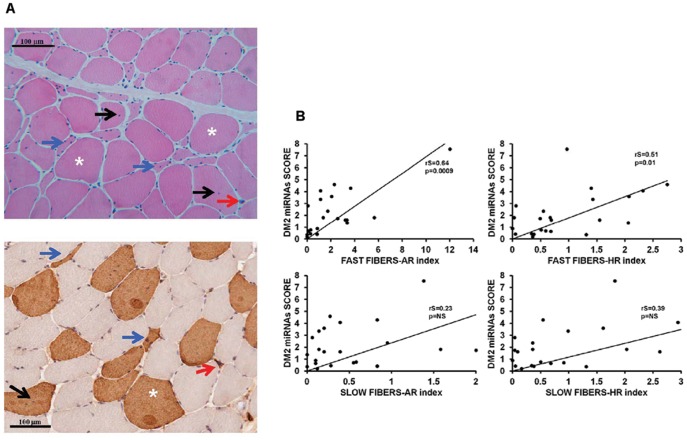
Figure 5. Correlation of atrophy and hypertrophy with DM2 miRNAs score.
A) Representative stainings of transverse sections of frozen DM2 muscle biopsies. Top panel shows a hematoxylin and eosin staining; bottom panel shows an immunostaining for fast myosin heavy chain. Atrophic (blue arrows) and hypertrophic (asterisks) myofibers, as well as nuclear clumps (red arrows) and internal nuclei (black arrows) are highlighted. B) Spearman’s correlation between DM2 miRNAs score and Atrophy (AR) or Hypertrophy (HR) indexes in fast and slow fibers (DM2 n = 13; CTR n = 9).

