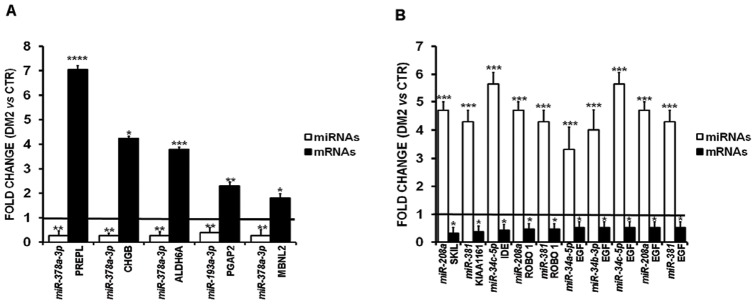
Figure 6. Validation of miRNA/mRNA interactions in DM2 patients.
Validation by qPCR of the expression of randomly selected mRNAs either up-(A) and down-(B) regulated in DM2 patients vs CTR. Expression level compared to CTR of the targeting miRNA is indicated for each mRNA (DM2 = 12, CTR = 10;*p≤0.05; **p≤0.01; ***p≤0.001; ****p≤0.0001).

