Fig. 1.
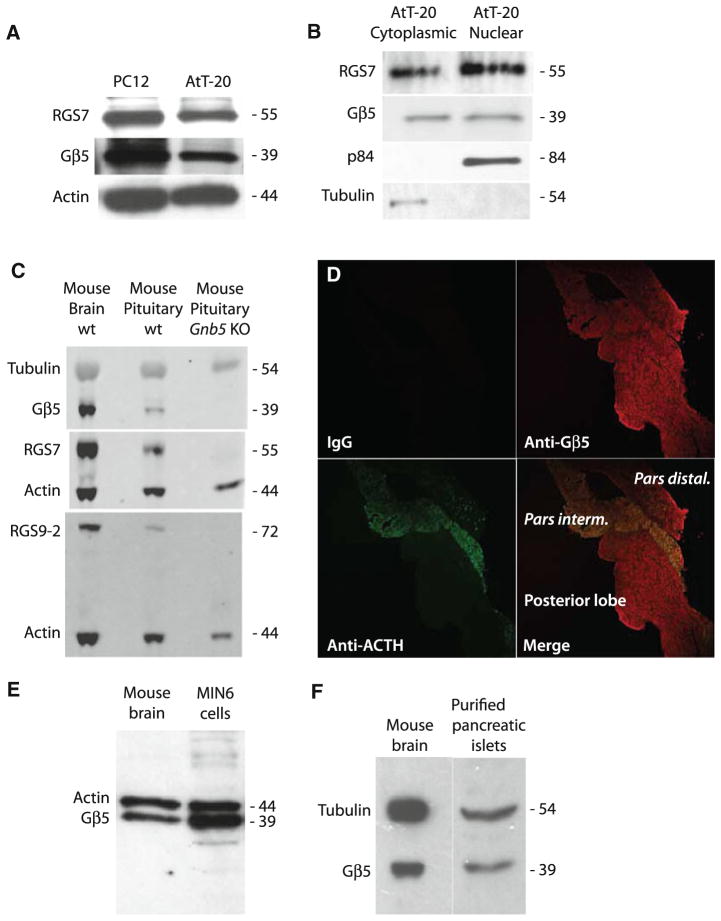
Expression of Gβ5 in AtT-20 cells, mouse pituitary, MIN6 insulinoma cells, and purified mouse pancreatic islets. a Whole cell lysates from AtT-20 and PC12 cells were prepared and analyzed for Gβ5 and RGS7 by SDS-PAGE followed by immunoblotting. The corresponding β-actin levels are shown as loading controls. b Subcellular distribution of Gβ5 and RGS7 in AtT-20 cells and PC12 cells are shown by immunoblotting using p84/N5 as marker for the nuclear fraction and α-tubulin as a marker for the cytoplasmic fraction. c Whole lysates were prepared from mouse brain and wild-type or Gβ5-knockout mouse pituitary gland and analyzed for Gβ5, RGS7, or RGS9-2 by immunoblotting with the corresponding tubulin or β-actin levels shown as loading controls. d Slides of mouse pituitary were stained using control IgG, anti-Gβ5, or anti-ACTH antibodies as indicated. The primary antibodies were visualized with Cy3-conjugated secondary antibody (red) for Gβ5 and with FITC-conjugated secondary antibody (green) for ACTH. The slides were analyzed using confocal laser microscopy. Magnification is ×40. e Whole cell lysates from MIN6 mouse insulinoma cells or mouse brain were prepared and analyzed for Gβ5 by immunoblotting. The corresponding β-actin levels are shown as loading controls. f Whole lysates from mouse brain or a purified preparation of pancreatic islets were prepared and analyzed for Gβ5 by immunoblotting. The corresponding α-tubulin levels are shown as loading controls

