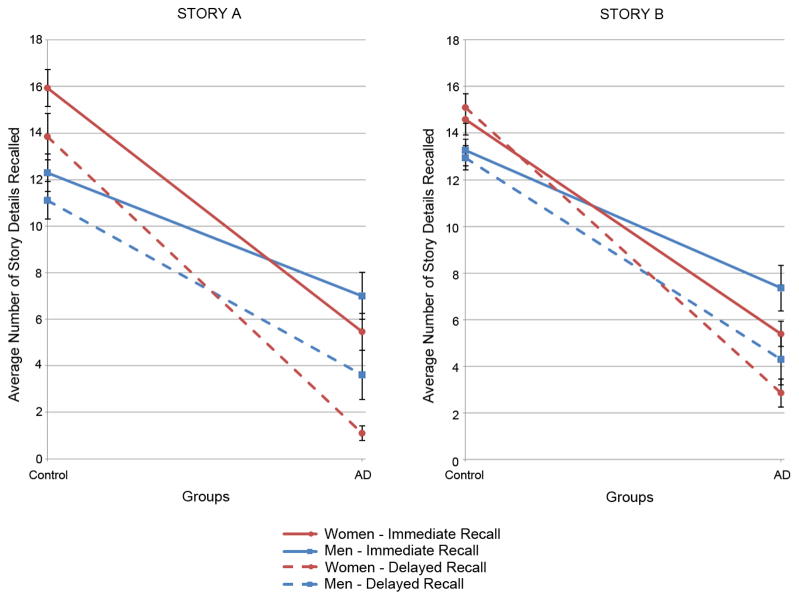
Figure 1.
The average number of story details recalled by men and women of the Control and AD groups. The immediate (solid lines) and delayed recall (dashed lines) scores are presented for both Story A and Story B (the immediate recall for Story B in this figure is the average of the first and second recall scores). Error bars represent SEM. The gender by group interaction is significant (p < .001).

