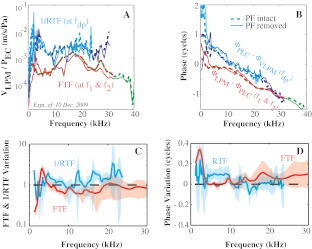
FIG. 3.
Effect of PF removal. The responses measured at the LPM before and after opening PF. An individual example is in A and B (experiment: 10 Dec. 2009, L1 = L2 = 80 dB, f2/f1 = 1.25, closed field). A Amplitude: VLPM/PEC. B Phase: VLPM − PEC at f1 and f2; PEC − VLPM at fdp. Dotted thick and solid thin lines indicate the results with PF intact and removed, respectively. Red and green are responses at f1 and f2 frequencies; cyan and blue are responses at 2f1–f2 and 2f2–f1 frequencies. C, D The average change in FTF and 1/RTF upon PF removal, using five data sets like that in A and B. C Amplitude change (after/before). D Phase difference (after–before). Bold and shaded indicate average ± standard deviation.

