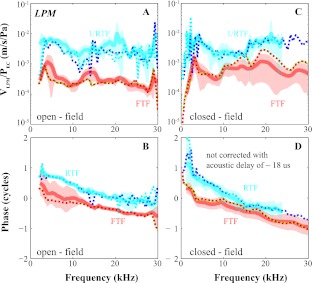
FIG. 4.
FTFEC-LPM and RTFEC-LPM with open- and closed-field sound configuration. Amplitude (A, C) and phase (B, D) of FTFEC-LPM and RTFEC-LPM with open- and closed-field sound configuration averaged across two and six animals, respectively. Bold and shaded indicate average ± standard deviation of f1 and f2 for FTF (red) and 2f1–f2 and 2f2–f1 for RTF (cyan). Dotted lines represent individual responses with open (10 Apr. 2008) and closed field (15 Dec. 2009). Green, red, cyan, and blue stand for f2, f1, 2f1–f2, and 2f2–f1. |1/RTFEC-LPM| was ∼10–20 dB larger than |FTFEC-LPM|. The group delay estimated by fitting a straight line with the phase–frequency curves showed a slightly longer RTFEC-LPM delay than FTFEC-LPM delay.

