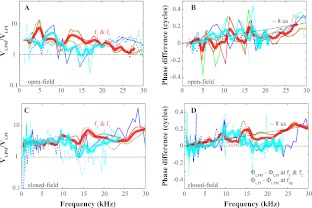
FIG. 6.
Relative velocity and phase between LPM and LPI. A, C Velocity ratio VLPM/VLPI. B, D Phase difference between VLPM and VLPI for open- and closed-field sound configuration. f1, f2, 2f1–f2, and 2f2–f1 are green, red, cyan, and blue, respectively. Thin solid and dotted lines were responses of two individual animals. Thick lines indicate the average at primary (red) or DP frequencies (cyan). All responses were at least 10 dB above the noise.

