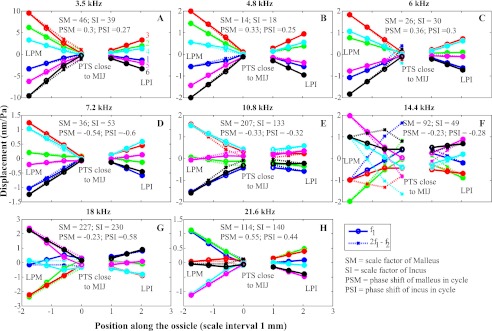
FIG. 8.
Displacement along ossicular chain from LPM to LPI in a co-linear system. This figure is comparable to the displacement panels of Figure 7, but now the displacement in forward and reverse transmission are shown in the same panel. The reverse displacements were scaled and shifted in time (see annotation in each panel). Different colors indicate different times in a cycle. Solid and dotted lines represent f1 and 2f1–f2 in forward and reverse transmission, respectively.

